Understanding Oracle OLAP Memory Management
When you work with the OLAP functionality in Oracle Database 10g, you need to be aware of how it handles memory. Just like a relational data warehouse, data held in multidimensional datatypes makes use of memory structures such as the System Global Area (SGA), Program Global Area (PGA) and User Global Area (UGA); in addition, the OLAP Option uses a number of caches, one of which, the Page Pool, is contained within the UGA which itself is either within the PGA or the SGA depending on whether you are running in dedicated server or shared server mode. If you're going to get the best out of the OLAP Option, you need to have a handle on how these memory structures are used, so that you know where to allocate additional resources to in order to improve query and load performance. So, in a nutshell, how does it all work?
UPDATE 15/02/2006 : Chris Chiappa dropped me a line with some comments and clarifications on a few points in the article. I've gone back and annotated the article with Chris' comments as there's some valuable point he makes. Chris' comments have "-CC" at the end and are in italics - MR.
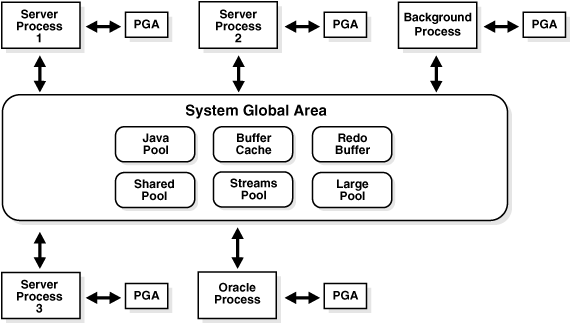
First, as a brief refresher, a typical diagram of the Oracle Server memory architecture looks like this:
When you use the OLAP Option and attach an analytic workspace, the OLAP engine within the database makes use of four caches:
- the Aggregate Cache - used for making a note of parent-child dimension relationships, you don't need to worry about this.
UPDATE 15/02/2006 : "I think the "Aggregate cache" gets a lot more attention than it deserves simply because it has some statistics available to the user. In reality, OLAP uses (a lot) more than 4 things internally that could be described as "caches", but the person who did the "Aggregate cache" (3 guesses, and the first 2 don't count :) ) wanted to be able to peek at it so it got some visible statistics. - CC"
- The Session Cache - used for storing the results of calculations - again you don't need to worry about this
- The Page Pool - this is where pages of data retrieved from the analytic workspace are held - you need to be aware of this and plan for it, and
- The database Buffer Cache - the same one that's part of the SGA that everyone else uses. Again you need to be aware of this.
UPDATE 15/02/2006 : "The Buffer Cache is relatively fast when compared to paging from disk, however is a fair bit slower than being able to find the page in the page pool to begin with. - CC"
In terms of optimising performance, the aim therefore should be to firstly have as much data held and retrieved from the Page Pool, and if this is not happening, to increase the size of the Page Pool so that it can accommodate your data. Then, as a fallback, you should ensure that the Buffer Cache is big enough to handle any queries that are too big for the Page Pool. However, and this is the usual proviso with any recommendation about buffer cache hit ratios, you need to ensure that your query is as efficient as possible - there's no point increasing your Page Pool to accomodate a query that is really just retrieving too many pages - an example of this would be where you've got your dimensions listed in the wrong order, and a typical query has to retrieve data from thousands of pages, rather than just a few at the start of the measure as you've clustered all the dimension members together.
If you are pretty sure though that your dimensions are listed correctly, and queries against V$AW_CALC indicate that POOL_MISSES is too high, then there are steps you can take to "tune" the memory available to the OLAP Option.
Compared to SGA and PGA tuning in earlier versions of Oracle, the process of tuning memory in Oracle Database 10g is a lot easier. Looking initially at dedicated server mode, and looking first at the PGA, as this where the Page Pool is located, there are two parameters you need to be aware of and one that is optional
- PGA_AGGREGATE_TARGET - which should be set to about 25% of available RAM for queries, and 50% for doing data loads. This part of the documentation also suggest 200MB to 400MB, which is about the same sort of figures when you're using a 32-bit OS.
- WORKAREA_SIZE_POLICY - which is normally set to AUTO.
- OLAP_PAGE_POOL_SIZE - normally this is tuned for you, but see below.
UPDATE 15/02/2006 : "Your description of what happens with the pga_aggregate_target isn't quite accurate. How it works is that each session has a maximum amount of the PGA that it will consume (50% as you note). It won't necessarily grow this big if it doesn't need to, but it might: many sessions eventually establish a "steady state" where they have all of the pages they need in memory and don't need more. In any case, another sesion can come in and also play the same game - as long as there is more space available in the PGA it will try to consume more, up to 50%. So, even if one was using all 50%, another session that comes in, as long as the PGA isn't full, will still try to allocate more. Additionally, all OLAP sessions will try to detect if the PGA is getting "too full" and reduce their own PGA usage. So, even if you have a couple of sessions hogging memory, over time things should even out - the big sessions should start giving memory back to the system, allowing the smaller ones to allocate some. One hitch in this approach is that the sessions can only check if they're active - if you have an idle session sitting around chewing up memory, it never gets woken up on its own so it never has the chance to give back the memory.
o Sessions by default allocate 256k to start (lower than the old fixed Page Pool Size of 4MB) although they typically ramp up their memory fairly quickly.
o Setting OLAP_PAGE_POOL_SIZE locks the size of the page pool, it doesn't set a lower boundary. You can set OLAP_PAGE_POOL_SIZE manually without having to disable WORKAREA_SIZE_POLICY=AUTO. In this case, the page pool would be locked in size but any other mechanisms employed by WORKAREA_SIZE_POLICY=AUTO will still engage. - CC"
It's a similar story with the SGA. The SGA, remember, is where the Buffer Cache is held which is where OLAP pages overflow to if the Page Pool is exceeded, and it's also where the Page Pool is in the first place if you're using shared servers. Like the PGA, there's now an automatic tuning feature available for the SGA, which is called Automatic Shared Memory Management (ASMM), and once turned on, it automatically juggles memory around between all the components of the SGA up to a limit that you define for it.
To manage the SGA, you use three parameters:
- SGA_TARGET - When this is set to any value > 0, it defines the target amount of memory that should be available to ASMM to assign to the Buffer Cache, Shared pool and other automatically tuned SGA components. This parameter should be set to between 50 percent and 60 percent of the total available memory on your server when working with OLAP data (bearing in mind of course the memory you've also allocated via PGA_AGGREGATE_TARGET)
- SGA_MAX_SIZE - This parameter sets the upper boundary for SGA_TARGET. Ensure that you increase this accordingly to accommodate any increases to SGA_TARGET
- STATISTICS_LEVEL - should be set to TYPICAL (the default) or ALL for ASMM to work.
UPDATE 15/02/2006 : "If you're running in shared server mode, you don't need to set OLAP_PAGE_POOL_SIZE (OLAP will still function) but it is probably a good idea. -CC"
The question this does raise though, and I've not had a chance to work out the figures to provide an answer, is what the benefit is in trying to fiddle around with the Page Pool in the first place - if queries spill over to the Buffer Cache anyway, and there's little performance degradation when this happens, why not just bump up the size of the SGA anyway, let the Buffer Cache handle all the caching, and not worry about the UGA and the Page Pool? Certainly one of my colleagues just uses this approach - allocate a few gigs of RAM to SGA_TARGET, don't worry about the PGA - and he's reported that performance has improved acceptably. Anyone got any ideas or experience on this?
UPDATE 15/02/2006 : "On your question about balancing page pool vs SGA, I would tend to go with your coworker on this: while resorting to the buffer cache isn't as fast as the page pool, in general it's "fast enough" and you usually reach a point of diminishing returns with the page pool: giving it hundreds of megs might bump your performance up a bit but not in a very signifigant way. The hope is that the dynamic page pool can serve the majority of requests and after that relying on the buffer cache isn't so bad. And certainly, giving more memory to the SGA has the advantage that it benefits more applications than just OLAP, giving you more flexibility. Back in 9.2 before the dynamic page pool the problem was often that it was too hard to get a "one size fits all" - the default 4MB was fine for 80% of the query users but you had some that really crawled across a lot more of the data and then your build users needed to have special stuff done for them. Hopefully now it's something you usually don't need to worry about - the dynamic page pool should give reasonable performance in most cases. - CC"
You can monitor usage of the PGA and OLAP Page Pool through the V$PGASTAT and the V$AW_CALC fixed views. As an example, you can connect as a user that has access to an analytic workspace, and then before making an attachment, display the values of SGA_TARGET, PGA_AGGREGATE_TARGET and OLAP_PAGE_POOL_SIZE using these SQL commands:
The above queries show the figures for the instance as a whole. You can also run the following query to view PGA and OLAP Page Pool usage for a particular user:SQL> conn gsw_aw/password@markr10g Connected. SQL> SHOW PARAMETER sga_target NAME TYPE VALUE -------------------------- ----------- ----------------------------- sga_target big integer 1G SQL> SHOW PARAMETER pga_aggregate_target NAME TYPE VALUE -------------------------- ----------- ----------------------------- pga_aggregate_target big integer 400M SQL> SHOW PARAMETER olap_page_pool_size NAME TYPE VALUE -------------------------- ----------- ----------------------- olap_page_pool_size big integer 0 SQL> SELECT 'OLAP Pages Occupying: ' 2 || round (( (( SELECT sum(nvl(pool_size,1)) 3 FROM v$aw_calc)) 4 / ( SELECT value 5 FROM v$pgastat 6 WHERE name = 'total PGA inuse') 7 ), 8 2 9 ) 10 * 100 11 || '%' info 12 FROM dual 13 UNION 14 SELECT 'Total PGA Inuse Size: ' 15 || value / 1024 || 'KB' info 16 FROM v$pgastat 17 WHERE name = 'total PGA inuse' 18 UNION 19 SELECT 'Total OLAP Page Size: ' 20 || round(sum(nvl(pool_size,1)) / 1024, 0) 21 || ' KB' info 22 FROM v$aw_calc 23 ORDER BY info DESC 24 / INFO ----------------------------------------------------------------- Total PGA Inuse Size: 16226KB Total OLAP Page Size: KB OLAP Pages Occupying: %
Now, we attach an analytic workspace.SQL> SELECT vs.username 2 , vs.sid 3 , round(pga_used_mem / 1024 / 1024, 2) || ' MB' pga_used_mem_mb 4 , round(pga_max_mem) / 1024 / 1024, 2) || ' MB' pga_max_mb 5 , round(pool_size) / 1024 / 1024, 2) || ' MB' olap_mb 6 , round(100 * (pool_hits - pool_misses) / pool_hits, 2) 7 || ' %' olap_ratio 8 FROM v$process vp 9 , v$session vs 10 , v$aw_calc va 11 WHERE session_id = vs.sid 12 AND addr = paddr 13 / no rows selected
SQL> exec dbms_aw.execute('aw attach gsw_aw.gsw_aw'); PL/SQL procedure successfully completed.
Now we run the above statements again. You can see from the statement output how much space is taken up by the OLAP Page Pool as a whole for the instance.
… and you can also see how much of the user’s PGA memory has been allocated following the analytic workspace attachment.SQL> ed Wrote file afiedt.buf 1 SELECT 'OLAP Pages Occupying: ' 2 || round (( (( SELECT sum(nvl(pool_size,1)) 3 FROM v$aw_calc)) 4 / ( SELECT value 5 FROM v$pgastat 6 WHERE name = 'total PGA inuse') 7 ), 8 2 9 ) 10 * 100 11 || '%' info 12 FROM dual 13 UNION 14 SELECT 'Total PGA Inuse Size: ' 15 || value / 1024 || 'KB' info 16 FROM v$pgastat 17 WHERE name = 'total PGA inuse' 18 UNION 19 SELECT 'Total OLAP Page Size: ' 20 || round(sum(nvl(pool_size,1)) / 1024, 0) 21 || ' KB' info 22 FROM v$aw_calc 23* ORDER BY info DESC SQL> / INFO ----------------------------------------------------------- Total PGA Inuse Size: 28167KB Total OLAP Page Size: 5271 KB OLAP Pages Occupying: 19%
UPDATE 15/02/2006 : "In 10.2, I find V$PROCESS_MEMORY to be a reasonably interesting view as well - OLAP reporting from there will include other memory that OLAP is using in the PGA as well, while V$AW_CALC only reports the memory in use by the page pool. - CC"SQL> ed Wrote file afiedt.buf 1 SELECT vs.username 2 , vs.sid 3 , round(pga_used_mem / 1024 / 1024, 2) || ' MB' pga_used_mem_mb 4 , round(pga_max_mem / 1024 / 1024, 2) || ' MB' pga_max_mb 5 , round(pool_size / 1024 / 1024, 2) || ' MB' olap_mb 6 , round(100 * (pool_hits - pool_misses) / pool_hits, 2) 7 || ' %' olap_ratio 8 FROM v$process vp 9 , v$session vs 10 , v$aw_calc va 11 WHERE session_id = vs.sid 12* AND addr = paddr SQL> / USERNAME SID PGA_USED_MEM_MB PGA_MAX_MB ---------------- ---------- --------------- ------------- GSW_AW 152 10.83 MB 11.72 MB
Finally, when sizing the SGA_TARGET and PGA_AGGREGATE_TARGET, ensure that you leave enough spare memory for the rest of the processes on your server (OS, other applications etc.). If you increase the size of the SGA_TARGET or PGA_AGGREGATE_TARGET beyond the amount of RAM that is available to you, the operating system will use virtual memory and start paging to disk, which will significantly slow down your application.