Creating Word and Tag Clouds using OBIEE 11g
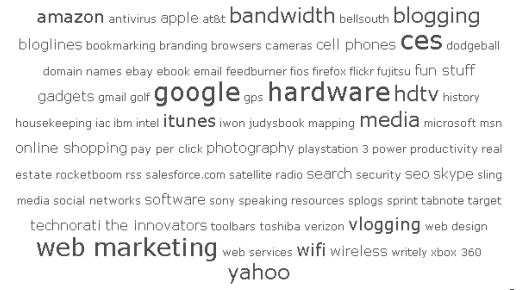
You may have heard of a data visualization technique called "word clouds", that are used to graphically show word distributions in unstructured data sets through font sizes and orientations. For example, the word cloud shown below shows the distribution of tech comments in an online article on the subject:
Probably most Oracle BI developers are aware of word clouds, and when used in the correct way are an effective way to visually represent, for example, the common words in a set of comments. What might interest you is that it's possible to display a word cloud in Oracle BI that doesn’t require anything other than out-of-the-box functionality, and can also navigate through to another analysis to display a detail-level list of those comments that contained a particular word.
The method shown uses the ability within Answers to render HTML content within a column, and works with both OBIEE 10g and the new 11g release; however, 11g introduces a new HardenXSS parameter into the instanceconfig.xml file that needs to be set to false (by default, it's omitted from the file and therefore defaults to true, preventing HTML from rendering in view columns). Once you've made the change, the security section of this file should look like this:
<Security>
<!--This Configuration setting is managed by Oracle Business Intelligence Enterprise Manager-->
<ClientSessionExpireMinutes>210</ClientSessionExpireMinutes>
<HardenXSS>false</HardenXSS>
</Security>
So you can follow along with this guide I have provided two XML Files with sample data, and an RPD repository file that uses these XML files as a data source, which can be downloaded from here. Once downloaded, extract the two XML Files to C:\oracle\wordcloud (or alter the RPD connection pool settings to point to where you saved the XML Files.) Then, upload the RPD via Enterprise Manager so that it is the default, online repository, using "password" as the repository password.
In terms of modeling the data, for this example I have used two source data tables that contain firstly, a set of comments, and secondly, a count of words used in the comments (note: XML Files have been used instead of relational tables in the example data, but you can use whatever source you like.) Typical DDL to create such tables would look like this:
CREATE TABLE COMMENT
(
comment_id NUMBER
,comment_text VARCHAR2(4000)
,CONSTRAINT wc_comments_pk1 PRIMARY KEY (comment_id)
);
CREATE TABLE WORD_COUNT
(
word VARCHAR2(255)
,word_count NUMBER
,CONSTRAINT wc_count_pk1 PRIMARY KEY (word)
);
In a real-life situation, there would also need to be some code to extract the words from the comments, correct spelling and remove common words like and, I, to, etc.
The modelling of this in the RPD is fairly straightforward, with the only complication being around linking the COMMENT and WORD_COUNT physical tables, which has in this case to be done using a complex join and the LOCATE function, linking counts in the WORD_COUNT table with individual words in the COMMENT table, using a join clause like this:
LOCATE(‘ ‘||WORD_COUNT.WORD||’ ‘,’ ‘||COMMENT.COMMENT_TEXT||’ ‘) > 0
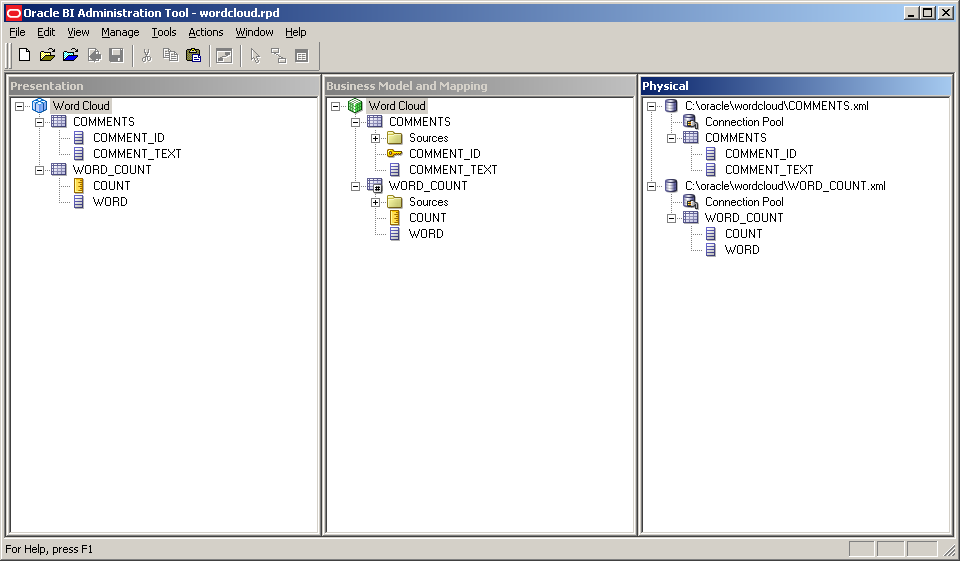
Once the physical layer is set up in the RPD, promote the source data through the business model and mapping layer and then the presentation layer, so that your RPD looks like this:
Next we will create two analyses to display the word cloud data; the first will be one that provides a detail view to navigate to when a word is clicked on the word cloud, whilst the second will be the actual word cloud itself, with hyperlinks on the words to navigate to the detail view. Start then by creating an analysis with the columns:
Column Name: COMMENTS.COMMENT_TEXT
Column Name: WORD_COUNT.WORD
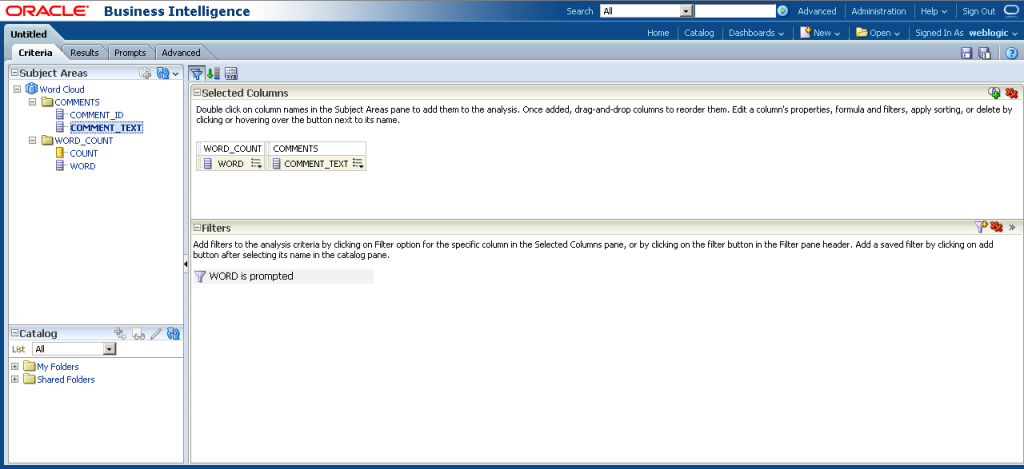
Then, hide the WORD_COUNT.WORD column and add an Is Prompted filter to it, so that your criteria tab looks like this:
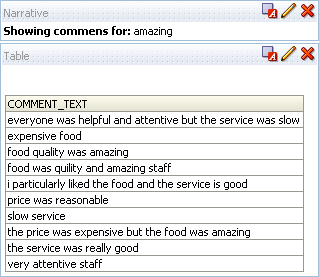
Just for aesthetics, you might want to add a narrative view to show the user the word they have filtered on. Once complete, this should result in an analysis which looks like this:
Save this answer to Shared Folders > Word Cloud Demo > Word Cloud Comments
Now you can create the second analysis that actually displays the word cloud. To do this, create an analysis with the columns:
Column Name: WORD_COUNT.WORD
Formula: WORD_COUNT.WORD
Sort: N/A
Filter: N/A
Column Name: WORD_COUNT.COUNT
Formula: WORD_COUNT.COUNT
Sort: N/A
Filter: in TOP 10
Column Name: FONT_SIZE
Formula: cast(WORD_COUNT.COUNT as double) / sum(WORD_COUNT.COUNT) * 200
Sort: N/A
Filter: N/A
Column Name: RAND
Formula: RAND()
Sort: ASC
Filter: N/A
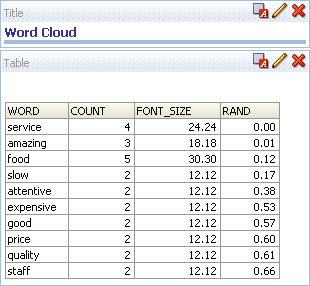
Once you've set the analysis criteria, switch to the results tab, which should now show a view that looks like this :
Next, add an additional narrative view, to display the word cloud itself. Within the narrative view settings, add the following HTML code:
<a href="saw.dll?Go&Path=/shared/Word Cloud/Word Cloud Comments&Action=Navigate&P0=1&P1=eq&P2=WORD_COUNT.WORD&P3=1+@1" style= "font-size:@3pt;">@1 </a>
Then, tick the Contains HTML Markup box (note that this will not work unless you've made the change to the instanceconfig.xml file mentioned at the start of this article.)
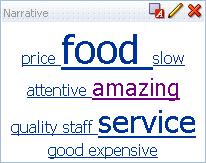
Next, return to the compound layout view, and remove the title and table views, leaving just the narrative view. Then, edit the properties of the narrative view and add an explicit width of 200, then check out the final display in the compound layout view which should look something like (with variations for the RAND sort) :
Finally, save this second analysis to Shared Folder > Word Cloud Demo > Word Cloud
Now you can start using the word cloud within Answers. Click on the words in the word cloud to display a listing of those comments that contain it, and include it in a dashboard if you'd like to present this as an interesting way to highlight significant contents in an unstructured data source.
