Oracle Enterprise Manager 12c Web Transaction Service Beacon
I wanted to continue on Mark Rittman’s excellent posts about the BI Management Packs and Enterprise Manager 12c:
There is an increasing demand to monitor BI systems, as they become more critical to businesses and their daily operations. I work in the Rittman Mead Global Services team, and we are starting to see an increasing demand for complete monitoring solutions. Within Global Services we are conscious that most BI systems go un-monitored or have only basic checks being performed. There are many aspects of a BI System that can be monitored, we need to be able to know if the system is up and how it is performing from both a system level and the end user experience. On that basis, I thought I’d share some of the more advance monitoring aspects of Enterprise Manager 12c (12.1.0.3).
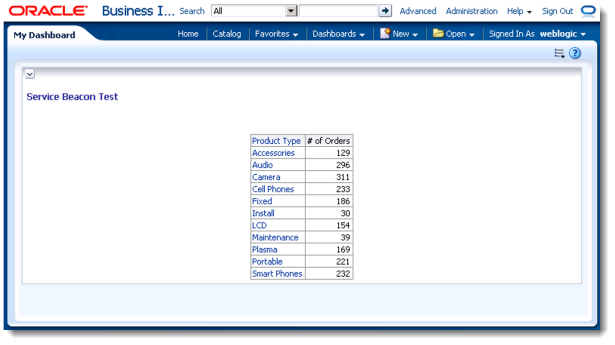
I’d like to start off with looking at "Service Beacons", which enable us to simulate a test that might be performed by a human, in particular I will be looking at web transactions which are a set of web based events. The goal is to simulate user logon to OBIEE and to test if an analysis comes back with an expected row set. In this example I used a vanilla install of OBIEE 11.1.1.7 with SampleAppLite, and create a simple analysis with ‘Product Type’ and ‘# of Orders’ placed on My Dashboard, which has been set up to be the default dashboard to show once logged in.
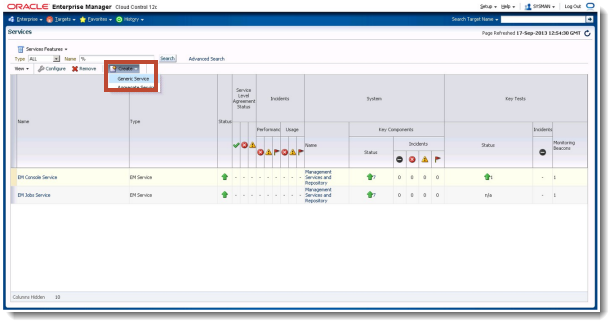
After connecting OBIEE to EM12c (as per Marks post), you can now add a Service Beacon to perform the aforementioned simulation. There is however a requirement to use Internet Explorer in order to record the user interaction, these are referred to as Web Transactions; I used Internet Explorer 8 but more on this later.
In the next screen enter a name for the service, in this example User Agent 1
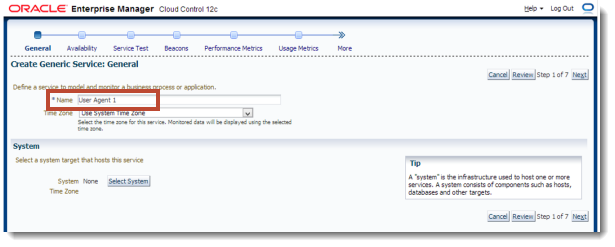
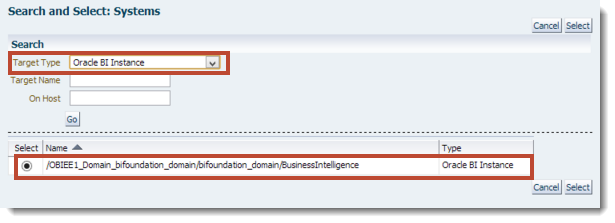
We also need to define what system this service should run on. Ideally you would place it on a dedicated system, in this case we will place it on the BI Server
Click Select System and select the Target Type: Oracle BI Instance, then press Select.
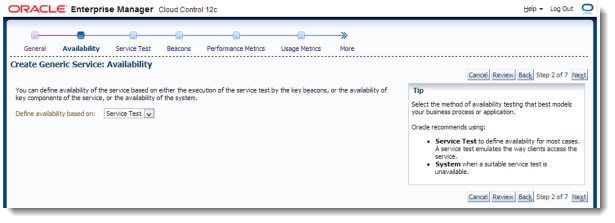
After returning to the General Page click Next to preceded to the Availability stage. Ensuring Service Test is selected click Next.
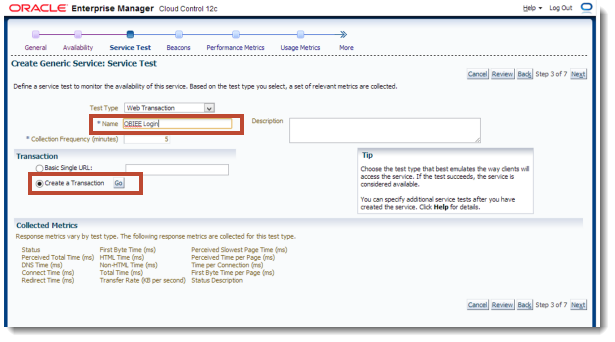
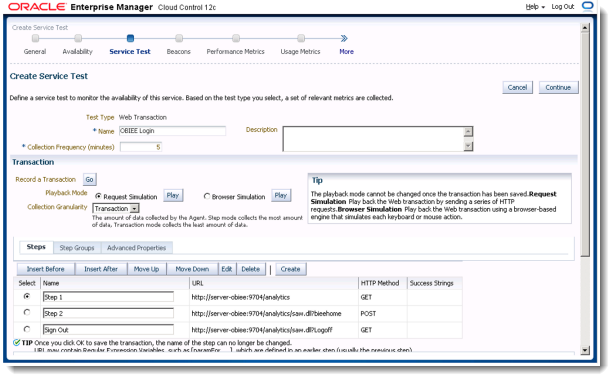
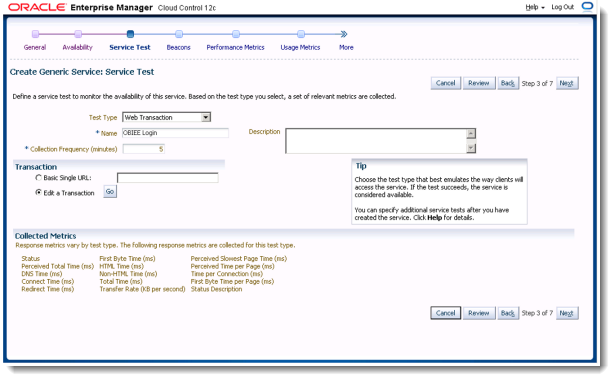
The Service Test step is where we can define our Web Transaction. Type in a name for the test, for example "OBIEE Login", and then select Create a Transaction and click Go.
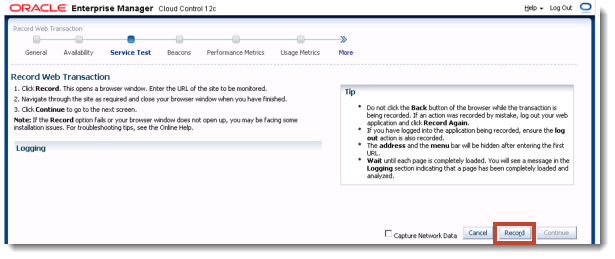
When clicking on Record, Internet Explorer will prompt you to install a plugin. For this plugin to install though, you'll most probably need to alter Internet Explorer's security settings, by editing the zone settings for IE to an unsecure state or adding the site to the trusted list and importing the certificates - see the Internet Explorer help files for full details on how to do this.
Once configured click on Record.
After this button is clicked, another instance of Internet Explorer is opened, displaying a blank web page.
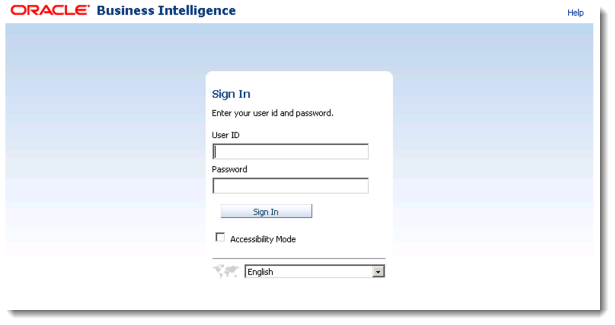
In this window enter the URL for OBIEE into the URL bar, and press Enter. You should then see the standard OBIEE login page, as shown below.
Navigate to the dashboard page that you're interested in setting up the service beacon for, to simulate a user bringing up this page.

Then log out and close the browser window.
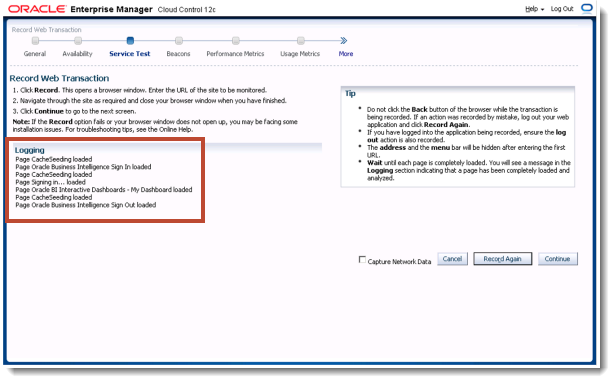
Back in the Enterprise Manager browser window, it should have recorded the login steps which should look similar to the screenshot below. Click Continue to proceed
Back on the service test screen there will a few steps filled out, this is the result of the transaction recording. At this stage it’s not easy to debug the process, so we need to continue the creation process. Click Continue to proceed.
Now back on the Service Test screen click Next.
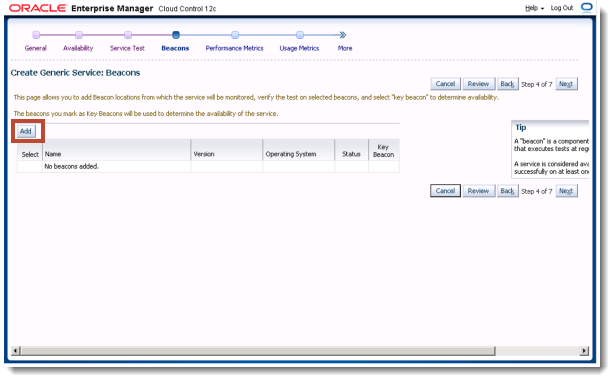
Next we need to add a beacon, where this service will monitored from. Click the Add button
In the basic setup the beacon installed as part of EM will be used. Ideally a beacon that replicated a client machine to simulate a realistic test.
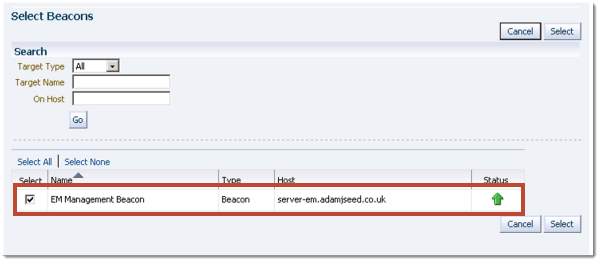
Select the EM Management Beacon and then Select
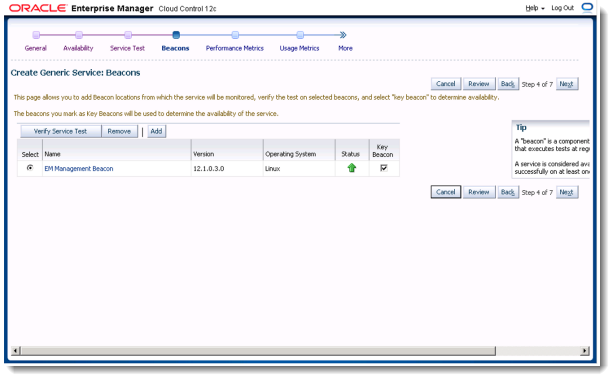
Now back on the Beacons screen click Next
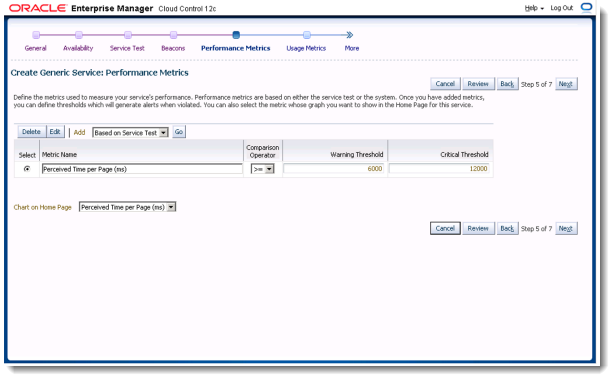
Enter the Performance Metrics required, in this example Click Next to go with the default values.
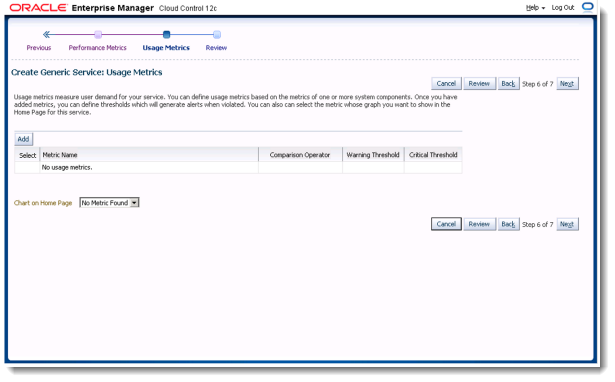
The Usage Metrics step is where we can associate metrics to this service test. For example if you have a few sessions initialised that could affect the login times to Oracle BI, it might be worth monitoring the connection pool usage to ensure that it’s not over used.
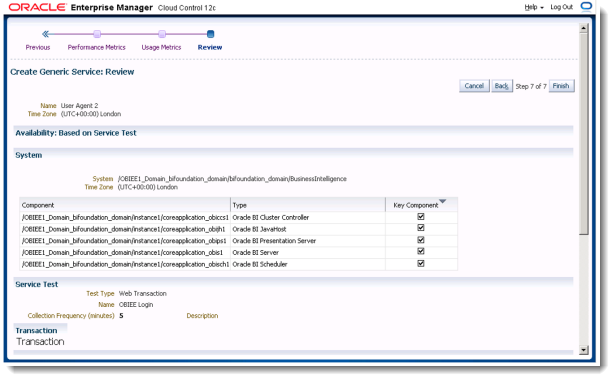
The final screen reviews what has been set up, for now we will complete the service creation by clicking the Finish button.
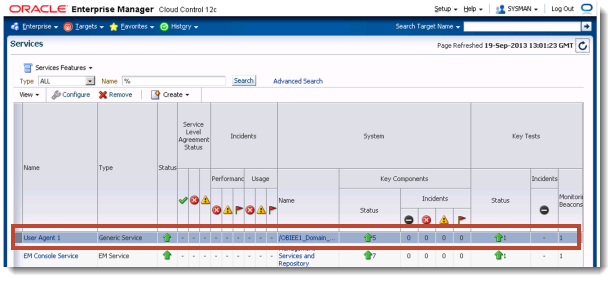
Returning back to the service page, our new service will have a clock next to it, until it has initialized and ran for the first time. After a couple of minutes refresh the page to see if the agent is up
Next we need to further configure this service, click on User Agent 1
note:At this point I will make it clear that my screenshots use a service is called User Agent 2, not User Agent 1
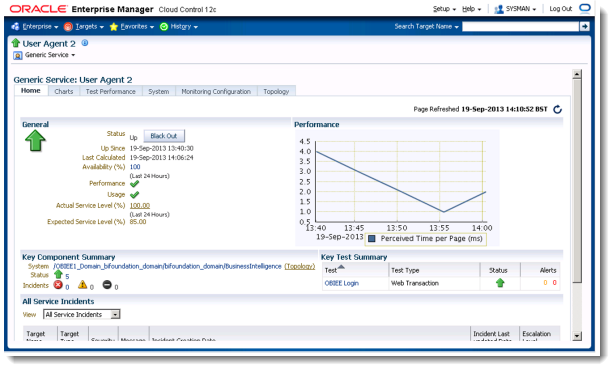
The initial home screen shows the performance of the service beacon, but for more details we need to navigate to the Monitoring Configuration screen
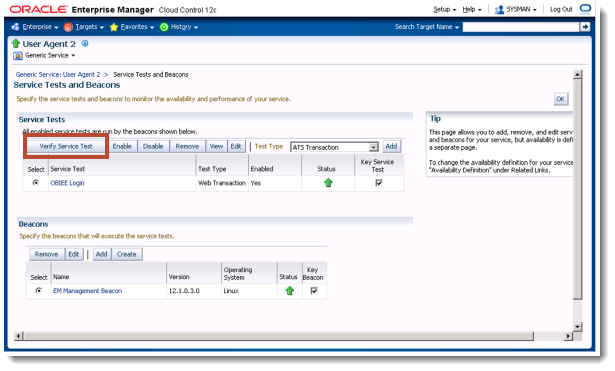
From this screen click on the Service Tests and Beacons Link
This screen is almost like the one during the setup process but has an added benefit, of running through the interaction to show us what is returning by clicking on Verify Service Test button.
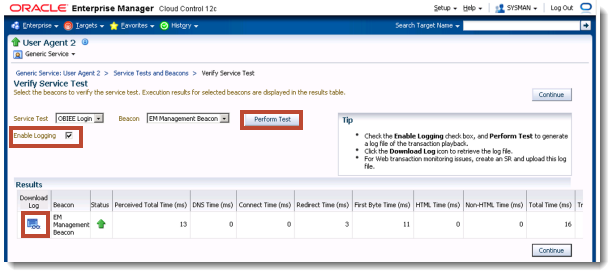
Tick the Enable logging box and then Perform test, Note that the Status is up and should be while the webpage is running, but we have not entered any success criteria. After the test, click on the download log icon
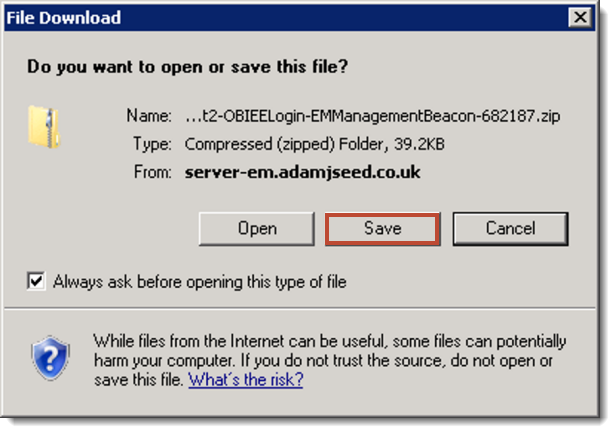
Save the log file
After downloading the log, extract it and locate the index.html and open.
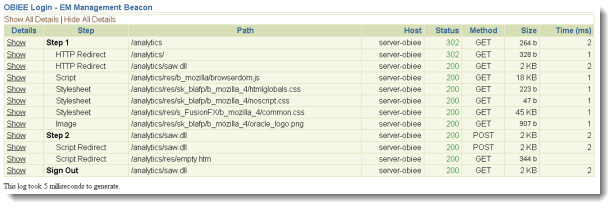
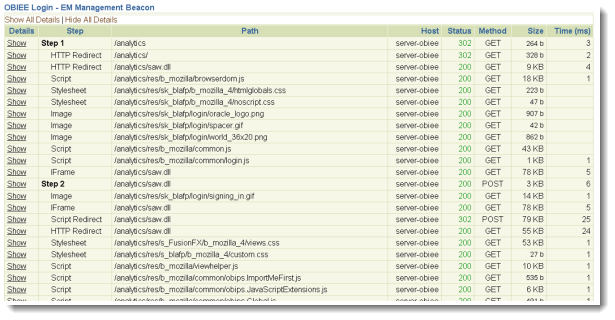
This should show the steps that the beacon has performed
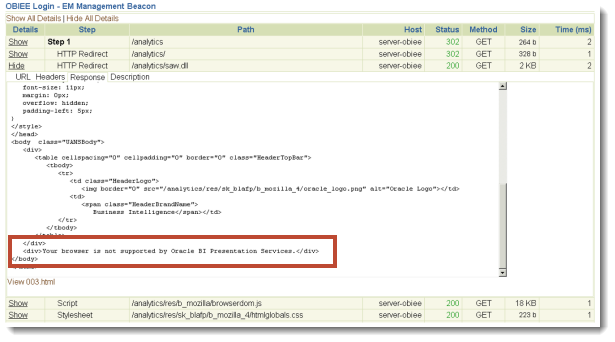
When examining the steps, one thing I notice is that OBIEE's presentation services is complaining about the browser version...
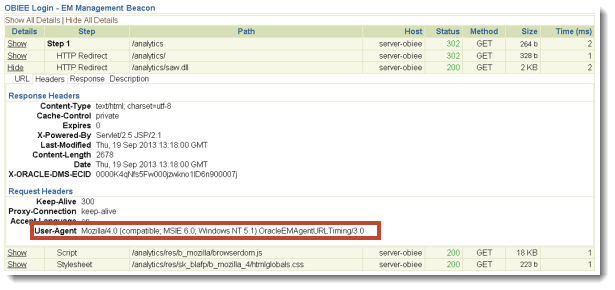
And after looking at the headers, the error is because the service test is identifying itself as Internet Explorer 6.0 - an unsupported browser for recent versions of OBIEE.
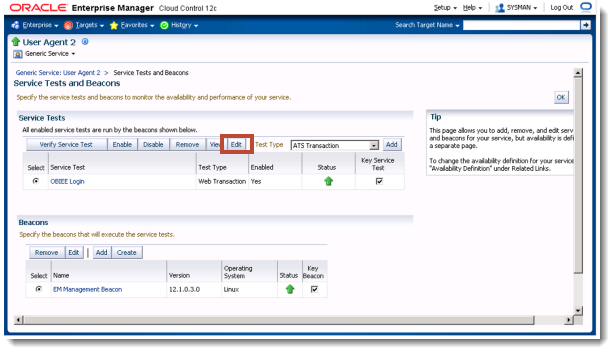
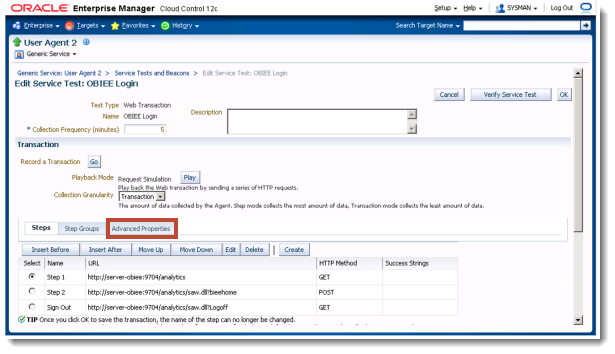
So our first task is change the User Agent that this service is running as. Return back to the Service Tests and Beacon page and ensure OBIEE login is selected and click Edit
Navigate to the Advance Properties Tab
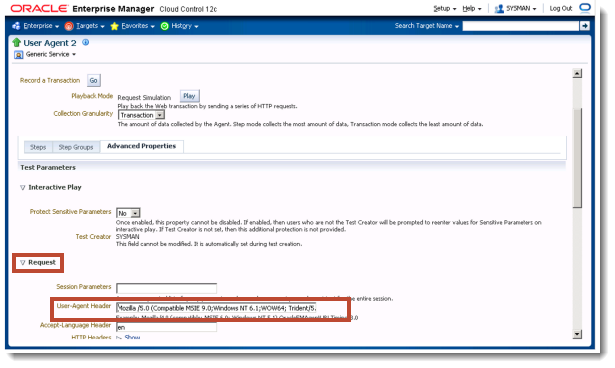
On this screen expand Request and replace the user agent with:
Mozilla /5.0 (Compatible MSIE 9.0;Windows NT 6.1;WOW64; Trident/5.0)
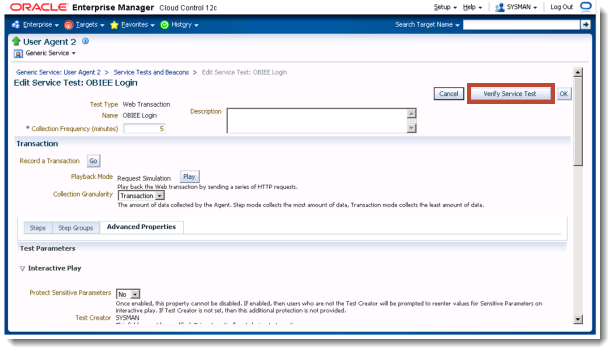
Now we can re-run the test from this page by scrolling up and clicking on Verify Service Test
Perform the test and download the log file, and you should notice it’s now much bigger.
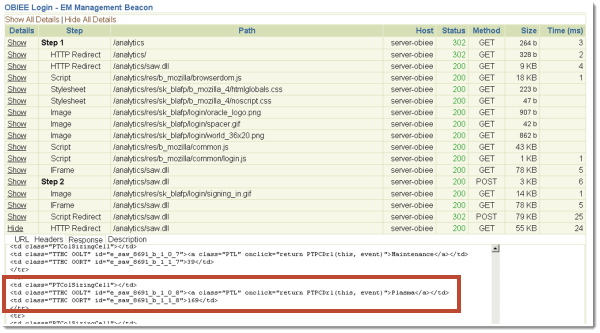
Now we need to find the step that has loaded our analysis, in this example it’s the HTTP Redirect element.
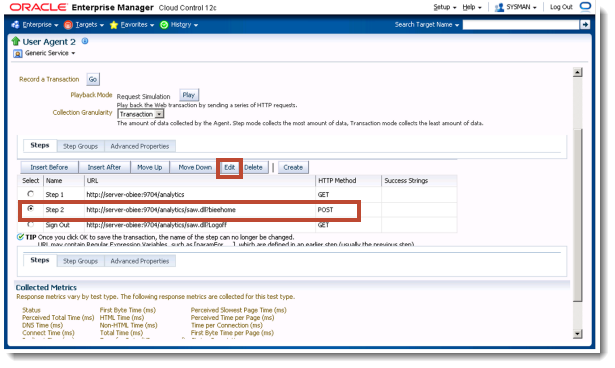
Using this we can go into step 2 of our process, navigate back to the steps tab and click Edit
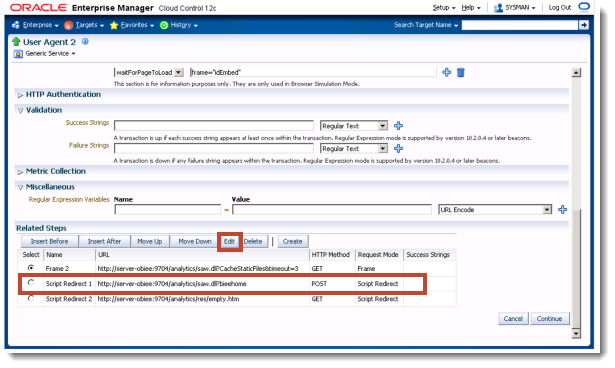
On the Step screen scroll down to the bottom and select the second redirect related step and click edit, this is the step that we need to add our validation test
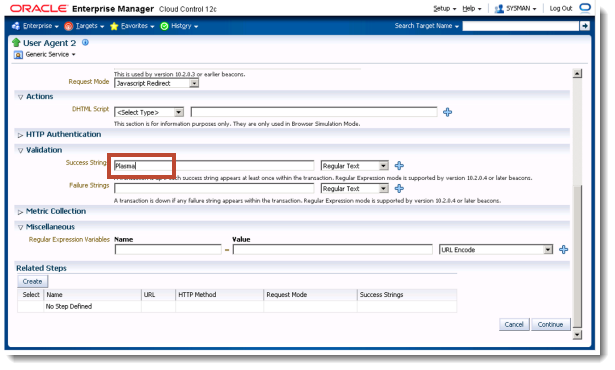
Scroll down to the Validation section and in this example we will add the validation text Plasma, as it was one of the product types returned in our initial analysis
Click Continue, Continue again and validate the service test again. If all is well it should be up.
You can now test this by either turning off your BI server or editing the analysis so that Plasma does not get returned. Either change should result in the service test going down.
This in depth setup provides a real world test to stop your end users telling you that your system is not working by proactively monitoring:
- The availability of the BI System
- The database returning results (and up to date results)
- The LDAP and login mechanism able to service request
- The time it takes to logon, return data and logoff.
- A growing set of metrics which can be used to generate system up time.
Stay tuned as I try to cover other elements of Enterprise Manger 12c that include other types of Service tests, Metric Templates and Administration Groups.
