OBIEE 11.1.1.7, Cloudera Hadoop & Hive/Impala Part 2 : Load Data into Hive Tables, Analyze using Hive & Impala
In yesterday’s post on analyzing Hadoop data using Cloudera CDH4, Amazon EC2 and OBIEE 11.1.1.7, I went through the setup process for Cloudera Manager Standard and then used it to set up a four-node Hadoop cluster in Amazon AWS’s EC2 service. In today’s post, we’ll use a tool called “Hue” to upload some flight delays stats from OBIEE’s SampleApp / Exalytics demos, create Hive tables over those files and then analyse them first using Hive, and then using Cloudera Impala. If you’ve not seen yesterday’s post then take a look at that first for the setup instructions, and then we’ll move on to today’s topics.
Using Hue to Create a Database and Upload Data to It
1. Hue is a web-based application that ships with Cloudera’s distribution of Hadoop, and is used to run queries against Hadoop and perform general data activities - think of it as SQL*Developer or ApEx for Hadoop, as compared to Cloudera Manager which is more like Oracle Enterprise Manager. To first navigate to Hue, go back to Cloudera Manager, select Services > hue1, then select Hue Web UI from the tabs over the Hue service details. You’re then taken to a setup screen where you can create a new Hue user for admin purposes - I’ll use the username/password “admin/admin”, and then press the Sign-Up button - which then takes me to Hue’s Quick Start Wizard, like this: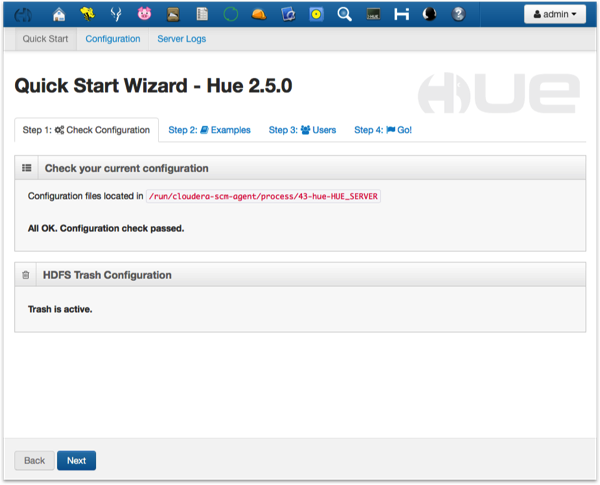
Press Next, and then click on the All button under the Install all the application examples label. This installs demo data for Hive, Impala, Pig (a procedural tool used for PL/SQL-type data transformation) and Oozie (a workflow tool). We won’t use this example data in this exercise, but it’s handy to have around for playing around with later.
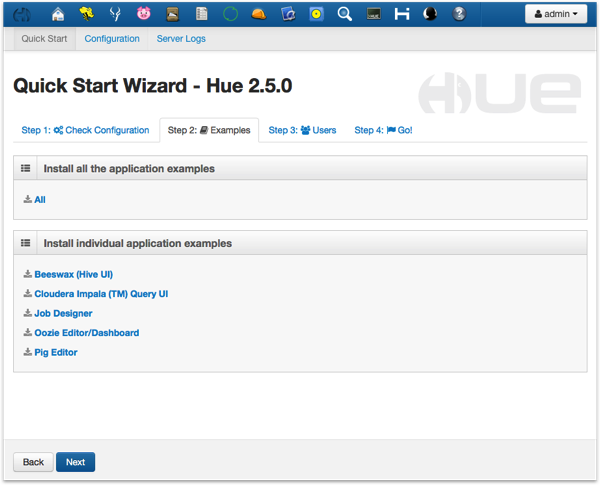
On the Step 3: Users page, click on the User Admin button and create a new user called “airlines”, password “airlines” - we’ll use this in a moment when uploading data to the cluster. Then return to the quick start wizard, press Next and then click on the Hue Home button to go into Hue proper.
- You’re now at the Hue homepage where you can upload and work with the HDFS filesystem, create Hive tables, use Sqoop 2 to connect to and load data from a relational database, and perform other tasks.
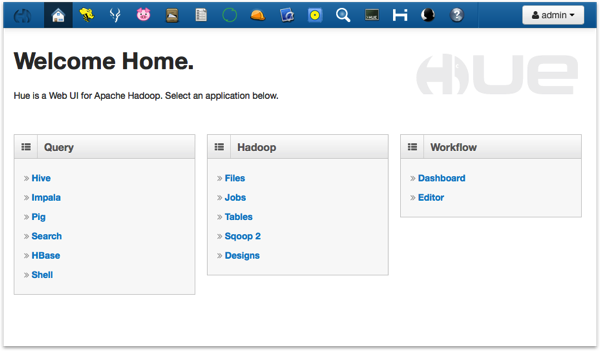
Select admin > Sign Out, and then log in again this time as the “airlines” user. We’re going to now use this user to create a new Hive database called “bi_airlines”, and then create tables out of four pipe-delimited files exported earlier from an Oracle database, and that I’ve uploaded to Dropbox in case you want to use them too.
- To create the new Hive database, click on the Tables link, and then the Databases link at the top of the page, like this:
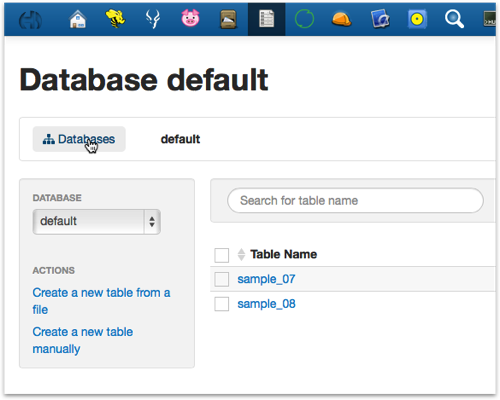
Then, when the next screen is displayed, click on the Create a new database link and call it “bi_airlines”, accepting the default location (in HDFS) for the files it uses. Press the Create Database button that’s then displayed, and check the log and the output to make sure it’s created OK. At that point then, you should see two databases displayed - the “bi_airlines” one you just created, and the default one.
- Click on the bi_airlines database to select it; another page will then be displayed that will list the tables within that database (which at this point is of course empty), and links to create a new table from a file, or to create one manually.
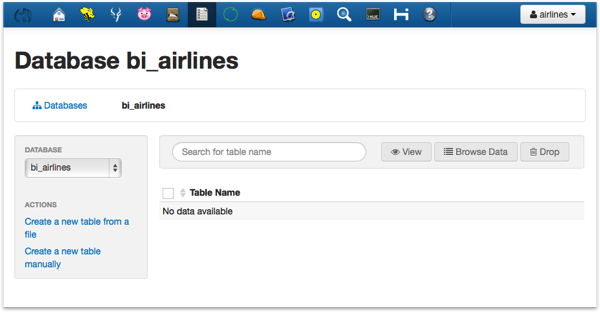
Now in the real world, you’d create your Hive tables manually as you’re most likely going to map them onto a directory of files (or set of directories, if you want to use Hive table partitioning), and you’re also likely to have done some processing using MapReduce, Pig, R or another tool before having the data in something resembling table file extracts. In this example though, we’re just going to use four pipe-delimited files and use Hue’s ability to upload a file and create a table from it automatically.
The four files we’ll be using are:
- flight_performance_2008-10.txt : three years of flight delay stats including origin and departure airport, number of flights, distance, arrival and departure delay in minutes (524MB)
- geog_dest.txt : destination airports, their state and city, as referenced in the flight stats (150KB)
- geog_origin.txt : the same set of data as the destinations file (150KB)
- carriers.txt : carrier (airline) codes and descriptions
- Still logged in as the “airlines” user, click on the Create a new table from a file link. Type in “flight_performance” as the table name, and then use the ellipses (“..”) button next to the file path area. When the Choose a File dialog is shown, press the Upload a File button and then navigate to the flight_performance_2008-10.txt file on your local machine. Double-click on the file to select it, and the Hue web UI will then upload the file to the Hadoop cluster, storing it on the HDFS distributed file-system (note that on a Mac I had to switch to Firefox to get this uploader to display).
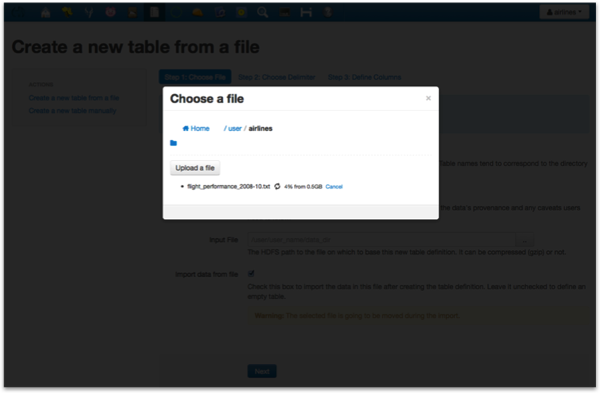
After a while the file will finish uploading; when it has, click on the link for it in the dialog to select it, and then move onto the next page in the wizard.
The Choose Delimiter page is then displayed. This file is pipe (“|”) delimited, so select Other as the Delimiter and key in “|” (no quotes); press Preview to then display the file data, which will look like this:
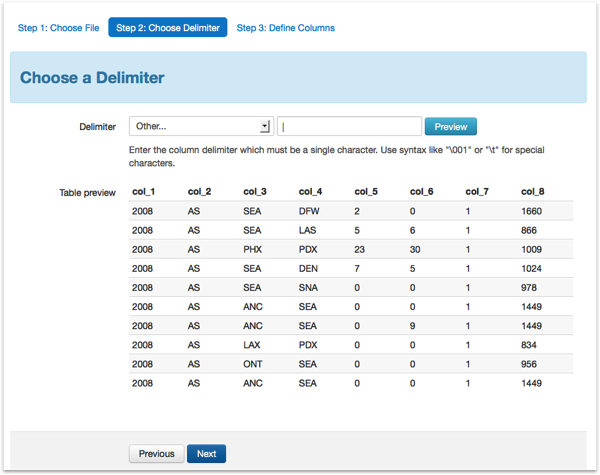
Press Next, and then define the columns in the table like this:
- Year (int)
- uniquecarrier (string)
- origin (string)
- dest (string)
- arrivaldelaymins (int)
- depdelaymins (int)
- flights (int)
- distance (int)
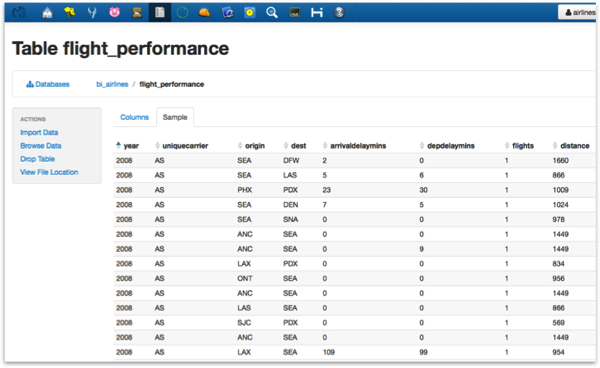
Then, repeat this process for the other three files, creating the following tables:
origin (based on geog_origin.txt)
- origin (string)
- origin_desc (string)
- origin_city (string)
- origin_state (string)
- origin_airportid (string)
- dest (string)
- dest_desc (string)
- dest_city (string)
- dest_state (string)
- dest_airportid (string)
- carrier (string)
- carrier_desc (string)
- When you normally upload files via Hue into Hadoop’s HDFS filesystem, it normally puts them into the home directory for that user in HDFS (for example /user/airlines/). If you choose to create a table from that file though, Hue and Hive move the file into Hive’s part of the HDFS filesystem, creating a sub-directory first for that new database. You can see where your files have gone by clicking on the File Browser button at the top of the Hue page, then navigating to /user/hive/warehouse/bi_airlines.db - you should see your files there (or more correctly, directories that contain your files). You can also map Hive tables to files outside of the /user/hive/warehouse directory (they’re called “external tables”), but this action is the default, and we’ll leave them there now.
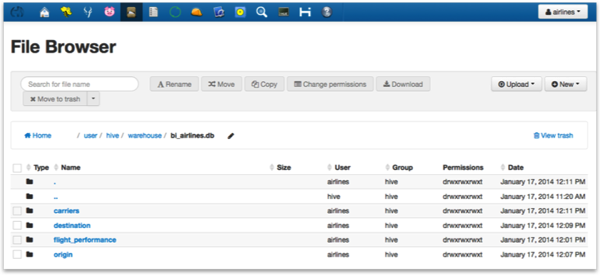
So where are these files kept, in this Hadoop cluster in the EC2 cloud. To find out, click on the flight_performance entry, and notice that the file (with the .txt extension) is actually contained within it - we’d actually clicked on a directory for that file. In fact, Hive tables can just as easily map onto a directory of files, so you could add in other years’ data here, or in fact thousands of files - this is usually how incoming data is received in big data-type applications. With the single flight_performance.txt file displayed, click on the file to view its contents, and then click on the View File link and then notice the First Block | Previous Block | Next Block | Last Block and bytes areas - HDFS in-fact breaks the file into blocks, and stores the file in several (redundant) places on nodes in the cluster, to give us fault-tolerance and make it easy for multiple nodes to process the dataset in block chunks.
7. So let’s start by running a couple of queries in Hive, using Hue again. Click on the Beeswax (Hive UI) icon at the top of the page, ensure bi_airlines is selected as the Database, and then type in the following HiveQL query:
select count(*) from flight_performance;
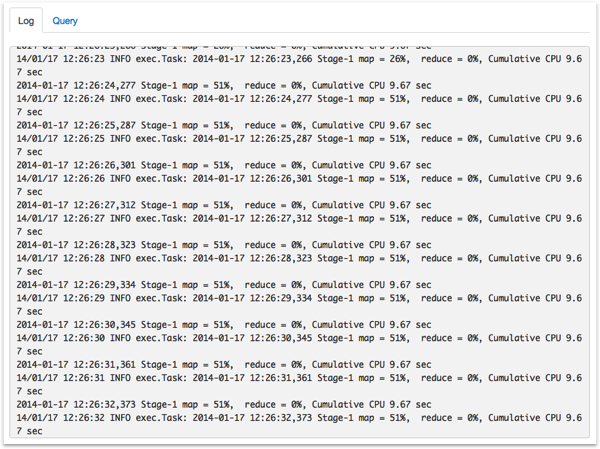
The count should return about 19m rows, and the query should take around a minute and a half to run. Now let’s try something more interesting:
select sum(f.flights)
from flight_performance f join origin o on (f.origin = o.origin)
where o.origin = 'SFO'
This time the query takes a bit longer, and when it completes you can see links for the two MapReduce jobs that it used to sum the flight data, as shown in the screenshot below:
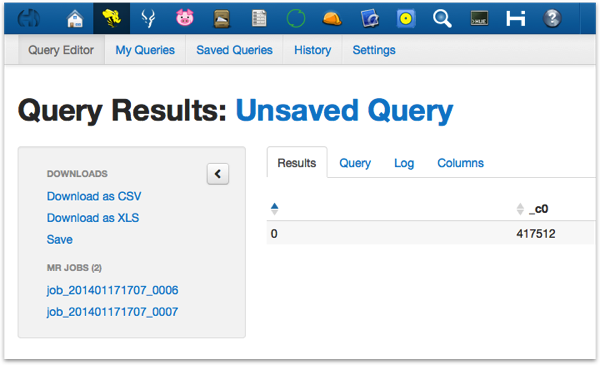
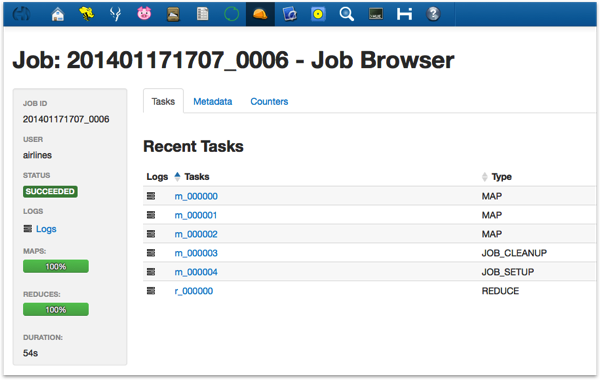
Click on one of the MR Jobs links and you can see a bit more detail about the MapReduce job that provided that part of the dataset - in the example below, there were three mappers that ran initially, then another two to setup and cleanup the job, and then one reducer to aggregate the data. Clicking on the other link is a similar story - a single mapper for the main data selection, then a reducer and control mappers to control and aggregate the dataset.
When you think about it, it’s pretty amazing what Hive does, compared to writing the MapReduce code yourself and then running it. And it’s probably fine for ETL-type access where most probably there’s a lot more data to load than just this small fact table, but it wouldn’t really be good for BI-type queries as we’re talking 1,2 or 3 minutes to return data. And that’s what Impala is for - access to the same data, using the same Hive catalog, but much-faster queries that don’t use MapReduce to retrieve the data.
8. So let’s run the same query using Impala. Click on the Cloudera Impala (TM) Query UI icon at the top of the Hue page, and select from the drop-down menu under Database - note how the bi_airlines database isn’t showing there. To have it show, go into the query editor area and type in:
invalidate metadata;
This will have Impala re-load the Hive catalog metadata, and the bi_airlines database should then be listed. Select it, and then try the same query as before:
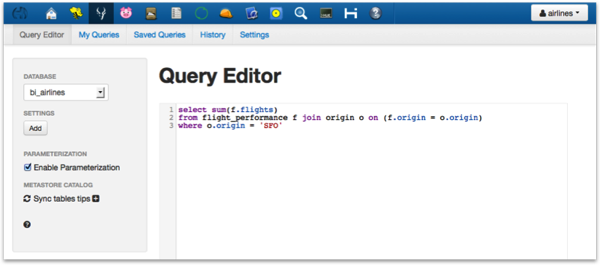
select sum(f.flights)

from flight_performance f join origin o on (f.origin = o.origin)

where o.origin = 'SFO';
This time when you run it, it returns in a couple of seconds. So now we’ve got some data and some options for querying it, let’s move over to OBIEE and try and connect it to the cluster.
Connecting OBIEE 11.1.1.7 to Cloudera Hadoop on Amazon EC2 using Hive and Impala
For simplicity’s sake, we’ll use OBIEE 11.1.1.7 running on Windows (Windows Server 2008 R2 64-bit, in my case), and we’ll use Cloudera’s own ODBC drivers to make the connection. Oracle’s recommendation is that you use Linux for Apache Hadoop / Hive connectivity though, and they provide their own drivers as part of the 11.1.1.7 install and on OTN; however I don’t think these connect to the Hiveserver2 service that recent CDH4 installs use, and I know these work. So starting with a standard install of OBIEE 11.1.1.7 on Windows 64-bit, follow these steps to initially connect via Hive.- Start by downloading the Impala and Hive ODBC drivers from the Cloudera website, which at the time of writing can be found here:
- Next we need to find the external EC2 DNS name for the virtual server we added the HiveServer2 service to in the previous article. Open up the Cloudera Manager website on the instance you created right back at the start of yesterday’s article to host Cloudera Manager, and navigate to the Hosts > All Hosts page, like this:
In my example, the virtual server that’s running HiveServer2 is displayed with its internal EC2 DNS name, like this:
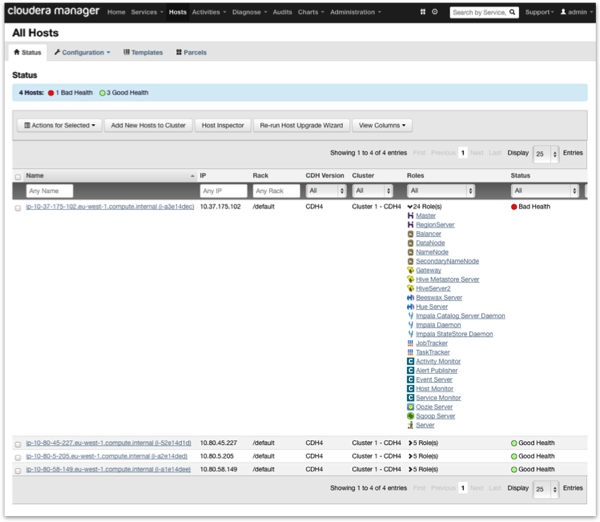
This name only works when you’re internal to the EC2 network though, so you’ll need to go over to the AWS Management Console and find the entry for that instance using the private DNS name, and then use that you retrieve the public one, like this:
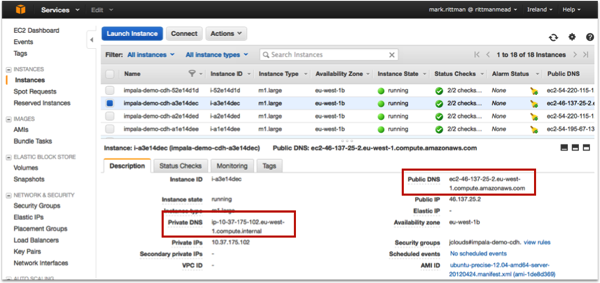
- Now you’re good to go. Back in the Windows desktop, click on System DSN, and then Add. In the list of ODBC data source drivers, you should see Cloudera ODBC Driver for Apache Hive; select it and press Finish.
Then, when the Cloudera ODBC Driver for Apache Hive DSN Setup dialog is shown, enter the following details, substituting the host name that you just retrieved in the previous step, that’s running HiveServer2:
Data Source Name : hive_demo
Host : <your host name with HiveServer2 running>
Port : 10000
Database : bi_airlines
Hive Server Type : HIve Server 2
Authentication Mechanism : User Name
User Name : airlines
so that the dialog looks like this:
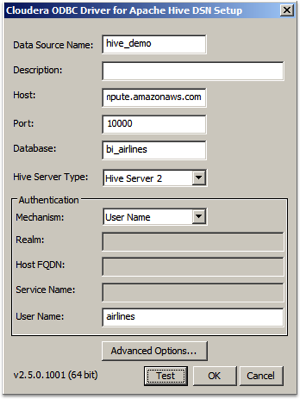
Press Test, and check that the test results are successful (note I’m using a slightly older version of the drivers, so the dialog might look a bit different in the latest version). Then press OK, and OK again to close the dialog and save the system DSN.
Now, create a new RPD or log into an online one that’s also on this OBIEE host server, so that any online access can also use the ODBC drivers you just installed. When the RPD is open for editing, select File > Import Metadata .., and then when prompted, select the DSN you created a moment ago - in my case, “hive_demo”, enter the airlines/airlines username and password, and then press Next to proceed to the table import page.
Make sure “Tables” is still checked, press Next, and then select and bring across the bi_airlines database you created earlier, as shown in the Data source view:
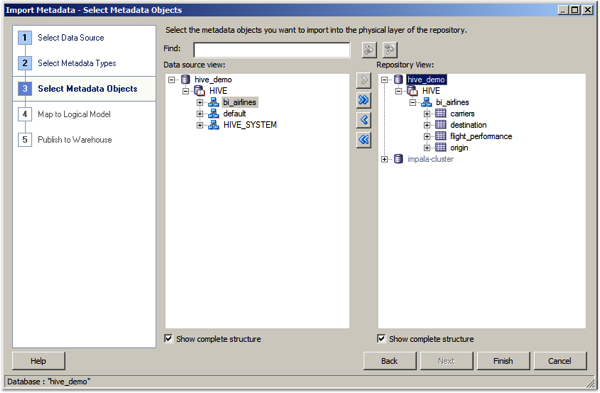
Press Finish to complete the metadata import.
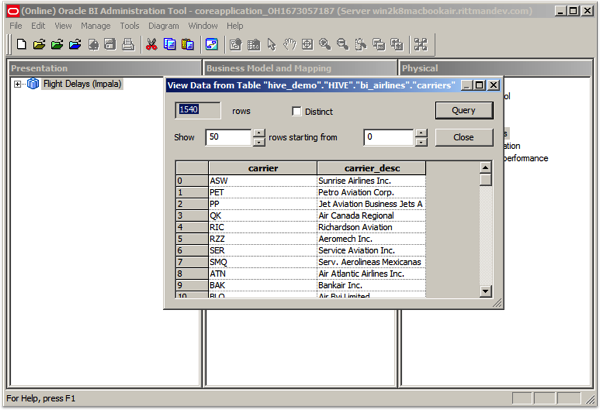
- Now click on the Hive physical database in the Physical panel in the BI Administration tool, to display the Database properties dialog. Change the Database type: from ODBC Basic to Apache Hadoop, and press No when asked if you’d like to edit the connection pool properties for this database, then press OK to close this dialog, then check in the changes to the RPD. To now check connectivity to the Hadoop cluster via Hive ODBC, right-click on one of the table and select View Data...
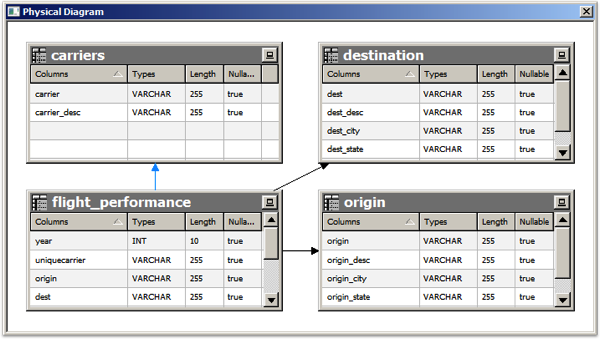
Once all is working OK, create keys on the origin.origin, destination.dest and carriers.carrier tables and then connect the fact table them, so you’ve got a physical model that looks like this:
Then, finally, pull the rest of the RPD together and create a simple report in answers; the key thing is that you get some data through, as I’ve managed to do in the screenshot below.
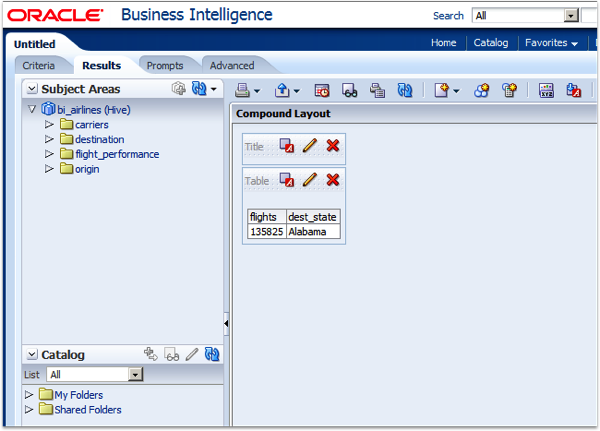
But of course - it’s not very fast - queries typically take 2, 3 minutes to run, and these are just simple ones. As I said earlier - fine for ETL, particularly when the dataset it likely to be a lot bigger, but not great for ad-hoc BI queries. So let’s set up an Impala connection instead, and see how that goes.
- Before this will work though, we’ll need to add the Impala port - 21050 - to the security group that Cloudera Manager created when it provisioned the Hadoop nodes yesterday. To do this, go back into the AWS Management Console, click on the Security Groups menu item and navigate to the security group set up by Cloudera Manager, in my case called “jclouds#impala-demo-cdh”. Click on it to select it, and use the Inbound tab to add an additional security rule like this:
Port Range : 21050
Source : 0.0.0.0/0
Then, press Add Rule and then Apply Rule Changes to add this additional port to the security group. Finally, check the list of ports now open for that security group to see that 21050 is now listed.
You can now over to the Windows environment, install the Impala ODBC drivers and use the ODBC Administrator utility in Windows and set up the Impala ODBC connection. In my case, I use the following values:
Data Source Name : impala_demo
Host : ec2-46-137-25-2.eu-west-1.compute.amazonaws.com
Port : 21050
Database : bi_airlines
Mechanism : No Authentication
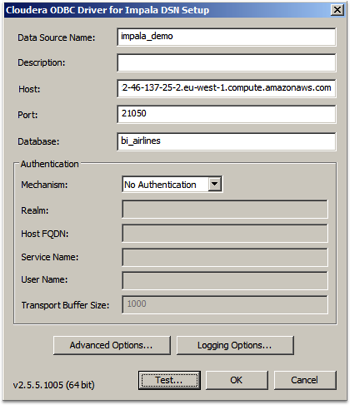
Press Test to check that it’s all working OK, and then import the bi_airlines tables into the RPD as you did with the Hive import.
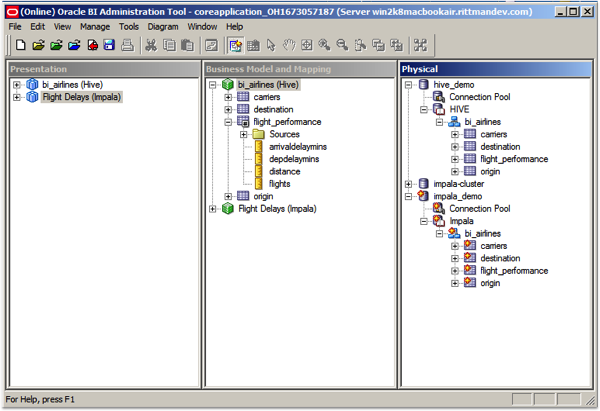
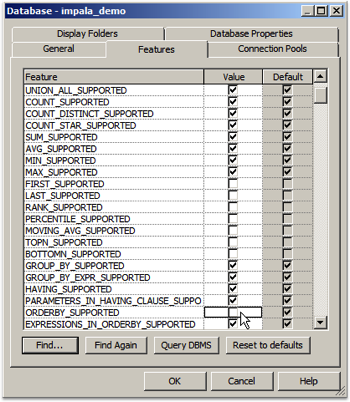
Double-click on the new physical database and set the database type to “Apache Hadoop” again. In addition though, click on the Features tab in the Database Properties dialog and uncheck the ORDERBY_SUPPORTED checkbox - Impala SQL requires a LIMIT clause after each ORDER BY but OBIEE doesn’t currently provide this (Impala’s an unsupported source at this point in time, so its not unexpected), so by unchecking this property we get the BI Server to do the results ordering, and queries will then run OK.
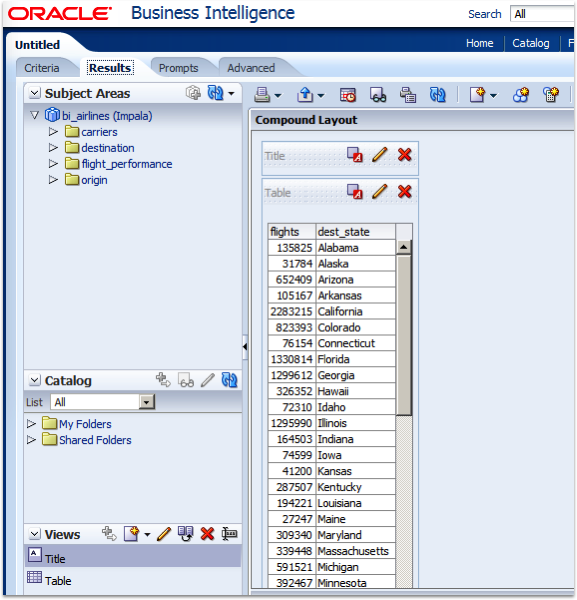
Right-click and select View Data… on one of the imported Impala tables to check that it returns data OK, and then build-out the rest of the RPD as you did with the Hive data. Now when results come back, they come back in a matter of seconds (and the results look more correct, too).
So there you have it - a more-or-less step-by-step to setting up a Hadoop cluster in Amazon EC2, then analysing data on it using OBIEE and Hive / Impala. Hopefully it was useful - more on this topic over the next few weeks.