Instrumenting OBIEE Database Connections For Improved Performance Diagnostics
Nearly four years ago I wrote a blog post entitled “Instrumenting OBIEE - The Final Chapter”. With hindsight, that title suffix (“The Final Chapter”) may have been a tad presumptuous and naïve of me (or perhaps I can just pretend to be ironic now and go for a five-part-trilogy style approach…). Back then OBIEE 11g had only just been released (who remembers 11.1.1.3 in all its buggy-glory?), and in the subsequent years we’ve had significant patchset releases of OBIEE 11g bringing us up to 11.1.1.7.150120 now and with talk of OBIEE 12c around the corner.
As a fanboi of Cary Millsap and his approach to measuring and improving performance, instrumenting code in general - and OBIEE specifically - is something that’s interested me for a long time. The article was the final one that I wrote on my personal blog before joining Rittman Mead and it’s one that I’ve been meaning to re-publish here for a while. A recent client engagement gave me cause to revisit the instrumentation approach and refine it slightly as well as update it for a significant change made in OBIEE 11.1.1.7.1.
What do I mean by instrumentation? Instrumentation is making your program expose information about what is being done, as well as actually doing it. Crudely put, it’s something like this:
10 PRINT "THE TIME IS " NOW()
20 CALL DO_MY_THING()
30 PRINT "I'VE DONE THAT THING, IT TOOK " X " SECONDS"
40 GOTO 10
Rather than just firing some SQL at the database, instead we associate with that SQL information about what program sent it, and what that program was doing, who was using it, and so on. Instrumentation enables you to start analysing performance metrics against tangible actions rather than just amorphous clumps of SQL. It enables you to understand the workload profile on your system and how that’s affecting end users.
Pop quiz: which of these is going to be easier to work with for building up an understanding of a system’s behaviour and workload?
CLIENT_INFO          MODULE                    ACTION       CPU_TIME DISK_READS
-------------------- ------------------------  ---------- ---------- ----------
                                               a17ff8e1         2999          1
                                               fe6abd92         1000          6
                                               a264593a         5999          2
                                               571fe814         5000         12
                                               63ea4181         7998          4
                                               7b2fcb68        11999          5
or
CLIENT_INFO          MODULE                    ACTION       CPU_TIME DISK_READS
-------------------- ------------------------  ---------- ---------- ----------
06 Column Selector   GCBC Dashboard/Performan  a17ff8e1         2999          1
05 Table with condit GCBC Dashboard/Performan  a264593a         5999          2
06 View Selector     GCBC Dashboard/Performan  571fe814         5000         12
05 Table with condit GCBC Dashboard/Performan  63ea4181         7998          4
<unsaved analysis>   nqsserver@obi11-01        fe6abd92         1000          6
<unsaved analysis>   nqsserver@obi11-01        7b2fcb68        11999          5
The second one gives us the same information as before, plus the analysis being run by OBIEE, and the dashboard and page.
The benefits of instrumentation work both ways. It makes DBAs happy because they can look at resource usage on the database and trace it back easily to the originating OBIEE dashboard and user. Instrumentation also makes life much easier for troubleshooting OBIEE performance because it’s easy to trace a user’s entire session through from browser, through the BI Stack, and down into the database.
Instrumentation for OBIEE - Step By Step
If you want the ‘tl;dr’ version, the “how” rather than the “why”, here we go. For full details of why it works, see later in the article.
- In your RPD create three session variables. These are going to be the default values for variables that we’re going to send to the database. Make sure you set “Enable any user to set the value”.
- SAW_SRC_PATH
- SAW_DASHBOARD
- SAW_DASHBOARD_PG
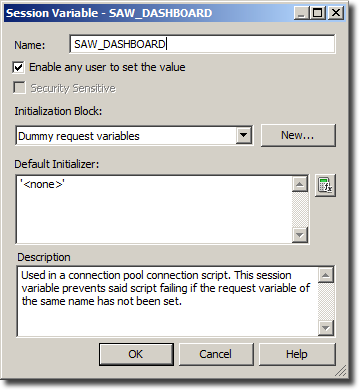

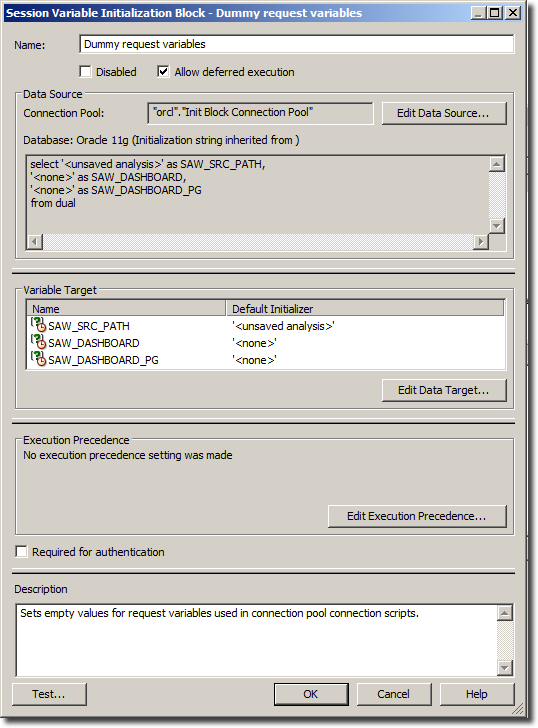
- Set up a session variable initialization block to populate these variables. It is just a “dummy” init block as all you’re doing is setting them to empty/default values, so a ‘SELECT … FROM DUAL’ is just fine:
SELECT
'<unsaved analysis>' as SAW_SRC_PATH,
'<none>' AS SAW_DASHBOARD,
'<none>' AS SAW_DASHBOARD_PG
FROM DUAL;
- For each Connection Pool you want to instrument, go to the Connection Scripts tab and add these three scripts to the Execute before query section:
-- Pass the OBIEE user's name to CLIENT_IDENTIFIER
call dbms_session.set_identifier('VALUEOF(NQ_SESSION.USER)')
-- Pass the Analysis name to CLIENT_INFO call dbms_application_info.set_client_info(client_info=>SUBSTR('VALUEOF(NQ_SESSION.SAW_SRC_PATH)',(LENGTH('VALUEOF(NQ_SESSION.SAW_SRC_PATH)')-instr('VALUEOF(NQ_SESSION.SAW_SRC_PATH)','/',-1,1))*-1))-- Pass the dashboard name & page to MODULE -- NB OBIEE >=11.1.1.7.131017 will set ACTION itself so there is no point setting it here (it will get overridden) call dbms_application_info.set_module(module_name=> SUBSTR('VALUEOF(NQ_SESSION.SAW_DASHBOARD)', ( LENGTH('VALUEOF(NQ_SESSION.SAW_DASHBOARD)') - INSTR('VALUEOF(NQ_SESSION.SAW_DASHBOARD)', '/', -1, 1) ) *- 1) || '/' || 'VALUEOF(NQ_SESSION.SAW_DASHBOARD_PG)' ,action_name=> '' );You can leave the comments in there, and in fact I’d recommend doing so to make it clear for future RPD developers what these scripts are for.Your connection pool should look like this:
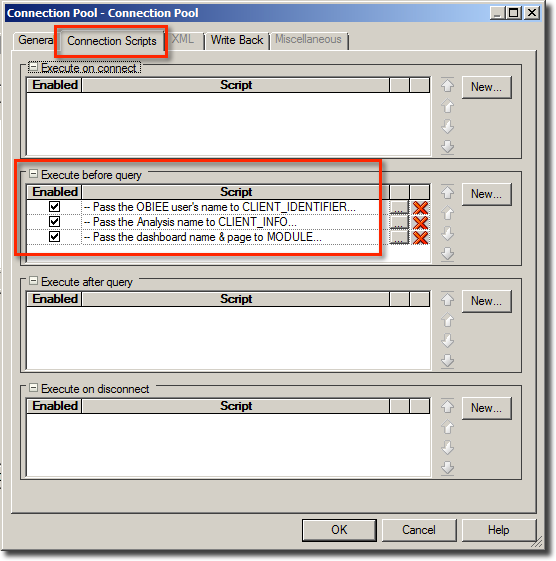
An important point to note is that you generally should not be adding these scripts to connection pools that are used for executing initialisation blocks. Initialisation block queries won’t have these request variables so if you did want to instrument them you’d need to find something else to include in the instrumentation.
Once you’ve made the above changes you should see MODULE, CLIENT_IDENTIFIER and CLIENT_INFO being populated in the Oracle system views :
SELECT SID,
       PROGRAM,
       CLIENT_IDENTIFIER,
       CLIENT_INFO,
       MODULE,
       ACTION
FROM   V$SESSION
WHERE  LOWER(PROGRAM) LIKE 'nqsserver%';
SID PROGRAM CLIENT_ CLIENT_INFO              MODULE                       ACTION
--- ------- ------- ------------------------ ---------------------------- --------
 17 nqsserv prodney Geographical Analysis 2  11.10 Flights Delay/Overview 32846912
 65 nqsserv prodney Delayed Fligth % history 11.10 Flights Delay/Overview 4bc2a368
 74 nqsserv prodney Delayed Fligth % history 11.10 Flights Delay/Overview 35c9af67
193 nqsserv prodney Geographical Analysis 2  11.10 Flights Delay/Overview 10bdad6c
302 nqsserv prodney Geographical Analysis 1  11.10 Flights Delay/Overview 3a39d178
308 nqsserv prodney Delayed Fligth % history 11.10 Flights Delay/Overview 1fad81e0
421 nqsserv prodney Geographical Analysis 2  11.10 Flights Delay/Overview 4e5d36c1
You’ll note that we don’t set ACTION - that’s because OBIEE now sends a hash of the physical query text across in this column, meaning we can’t use it ourselves. Unfortunately the current version of OBIEE doesn’t store the physical query hash anywhere other than in nqquery.log, meaning that you can’t take advantage of it (i.e. link it back to data from Usage Tracking) within the database alone.
That’s all there is to it - easy! If you want to understand exactly how and why it works, read on…
Instrumentation for OBIEE - How Does it Work?
Connection Pools
When OBIEE runs a dashboard, it does so by taking each analysis on that dashboard and sending a Logical Request for that analysis to the BI Server (nqsserver). The BI Server parses and compiles that Logical request into one or more Physical requests which it then sends to the source database(s).
OBIEE connects to the database via a Connection Pool which specifies the database-specific connection information including credentials, data source name (such as TNS for Oracle). The Connection Pool, as the name suggests, pools connections so that OBIEE is not going through the overhead of connecting and disconnecting for every single query that it needs to run. Instead it will open one or more connections as needed, and share that connection between queries as needed.
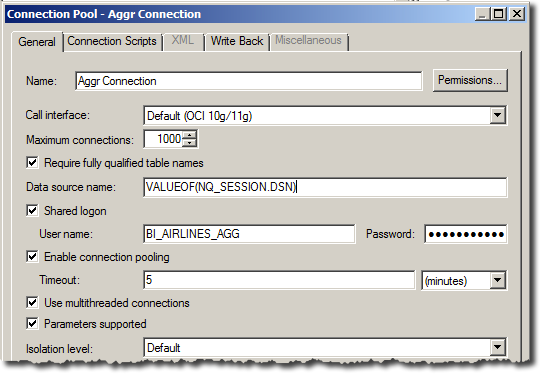 As well as the obvious configuration options in a connection pool such as database credentials, OBIEE also supports the option to send additional SQL to the database when it opens a connection and/or sends a new query. It’s this nice functionality that we piggy-back to enable our instrumentation.
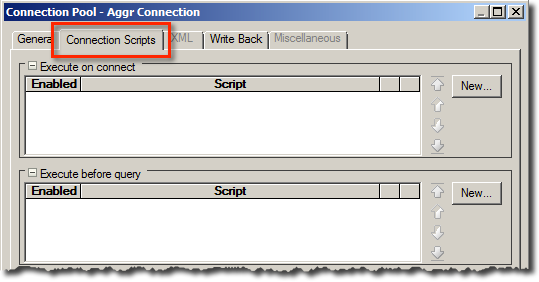
Variables
The information that OBIEE can send back through its database connection is limited by what we can expose in variables. From the BI Server’s point of view there are three types of variables:
- Repository
- Session
- Request
The first two are fairly simple concepts; they’re defined within the RPD and populated with Initialisation Blocks (often known as “init blocks”) that are run by the BI Server either on a schedule (repository variables) or per user (session variables). There’s a special type of session variables known as System Session Variables, of which USER is a nice obvious example. These variables are pre-defined in OBIEE and are generally populated automatically when the user session begins (although some, like LOGLEVEL, still need an init block to set them explicitly).
The third type of variable, request variable, is slightly less obvious in function. In a nutshell, they are variables that are specified in the logical request sent to the BI Server, and are passed through to the internals of the BI Server. They’re often used for activating or disabling certain functionality. For example, you can tell OBIEE to specifically not use its cache for a request (even if it finds a match) by setting the request variable DISABLE_CACHE_HIT.
Request variables can be set manually inline in an analysis from the Advanced tab:
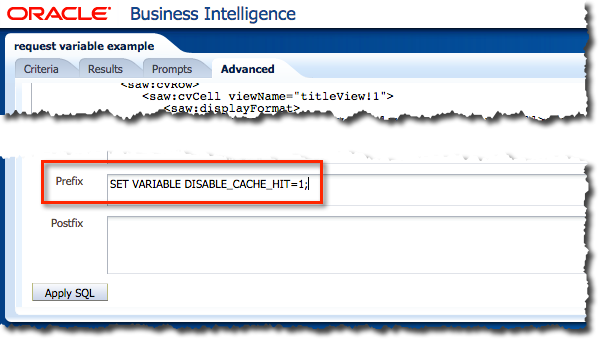 And they can also be set from Variable Prompts either within a report prompt or as a standalone dashboard prompt object. The point about request variables is that they are freeform; if they specify the name of an existing session variable then they will override it (if permitted), but they do not require the session variable to exist. We can see this easily enough - and see a variable request prompt in action at the same time. From the Prompts tab of an analysis I’ve added a Variable Prompt (rather than the usual Column Prompt) and given it a made up name, FOO:
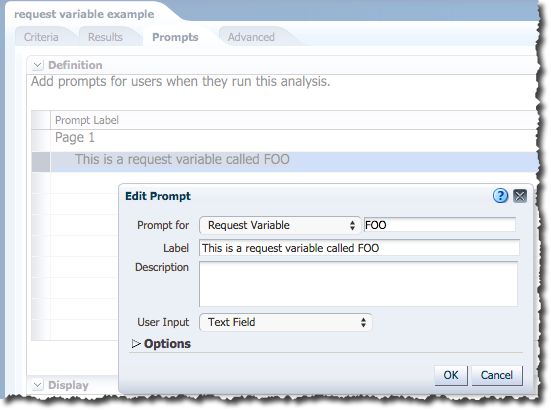 Now when I run the analysis I specify a value for it:
 and in the query log there’s the request variable:
-------------------- SQL Request, logical request hash:
bfb12eb6
SET VARIABLE FOO='BAR';
SELECT
   0 s_0,
   "A - Sample Sales"."Base Facts"."1- Revenue" s_1
FROM "A - Sample Sales"
ORDER BY 1
FETCH FIRST 5000001 ROWS ONLY
I’ve cut the quoted Logical SQL down to illustrate the point about the variable, because what was actually there is this:
-------------------- SQL Request, logical request hash:
bfb12eb6
SET VARIABLE QUERY_SRC_CD='Report',SAW_SRC_PATH='/users/prodney/request variable example',FOO='BAR', PREFERRED_CURRENCY='USD';
SELECT
   0 s_0,
   "A - Sample Sales"."Base Facts"."1- Revenue" s_1
FROM "A - Sample Sales"
ORDER BY 1
FETCH FIRST 5000001 ROWS ONLY
which brings me on very nicely to the key point here. When Presentation Services sends a query to the BI Server it does so with a bunch of request variables set, including QUERY_SRC_CD and SAW_SRC_PATH. If you’ve worked with OBIEE for a while then you’ll recognise these names - they’re present in the Usage Tracking table S_NQ_ACCT. Ever wondered how OBIEE knows what values to store in Usage Tracking? Now you know. It’s whatever Presentation Services tells it to. You can easily test this yourself by playing around in nqcmd:
[oracle@demo ~]$ rlwrap nqcmd -d AnalyticsWeb -u prodney -p Admin123 -NoFetch

-------------------------------------------------------------------------------
          Oracle BI ODBC Client
          Copyright (c) 1997-2013 Oracle Corporation, All rights reserved
-------------------------------------------------------------------------------

[...]

Give SQL Statement: SET VARIABLE QUERY_SRC_CD='FOO',SAW_SRC_PATH='BAR';SELECT 0 s_0 FROM "A - Sample Sales"
SET VARIABLE QUERY_SRC_CD='FOO',SAW_SRC_PATH='BAR';SELECT 0 s_0 FROM "A - Sample Sales"

Statement execute succeeded
and looking at the results in S_NQ_ACCT:
BIEE_BIPLATFORM@pdborcl > select to_char(start_ts,'YYYY-MM-DD HH24:MI:SS') as start_ts,saw_src_path,query_src_cd from biee_biplatform.s_nq_acct where start_ts > sysdate -1 order by start_ts;

START_TS            SAW_SRC_PATH                             QUERY_SRC_CD
------------------- ---------------------------------------- --------------------
2015-03-21 11:55:10 /users/prodney/request variable example  Report
2015-03-21 12:44:41 BAR                                      FOO
2015-03-21 12:45:26 BAR                                      FOO
2015-03-21 12:45:28 BAR                                      FOO
2015-03-21 12:46:23 BAR                                      FOO
Key takeaway here: Presentation Services defines a bunch of useful request variables when it sends Logical SQL to the BI Server:
- QUERY_SRC_CD
- SAW_SRC_PATH
- SAW_DASHBOARD
- SAW_DASHBOARD_PG
Embedding Variables in Connection Script Calls
There are four options that we can configure when connecting to the database from OBIEE. These are:
- CLIENT_IDENTIFIER
- CLIENT_INFO
- MODULE
- ACTION
As of OBIEE version 11.1.1.7.1 (i.e. OBIEE >= 11.1.1.7.131017) OBIEE automatically sets the ACTION field to a hash of the physical query - for more information see Doc ID 1941378.1. That leaves us with three remaining fields (since OBIEE sets ACTION after anything we do with the Connection Pool):
- CLIENT_IDENTIFIER
- CLIENT_INFO
- MODULE
The syntax of the command in a Connection Script is physical SQL and the VALUEOF function to extract the OBIEE variable:
- VALUEOF(REPOSITORY_VARIABLE)
- VALUEOF(NQ_SESSION.SESSION_VAR)
- VALUEOF(NQ_SESSION.REQUEST_VAR)
As a simple example here is passing the userid of the OBIEE user, using the Execute before query connection script:
-- Pass the OBIEE user's name to CLIENT_IDENTIFIER
call dbms_session.set_identifier('VALUEOF(NQ_SESSION.USER)')
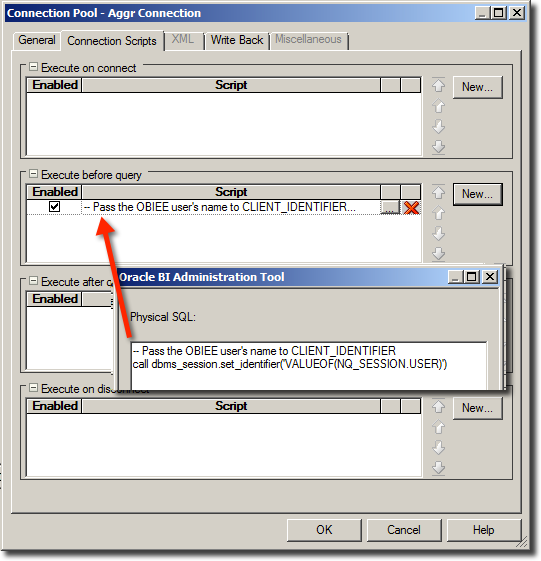 This would be set for every Connection Pool - but only those used for query execution - not init blocks. Run a query that is routed through the Connection Pool you defined the script against and check out V$SESSION:
SQL> select sid,program,client_identifier from v$session where program like 'nqsserver%';

       SID PROGRAM                                          CLIENT_IDENTIFIER
---------- ------------------------------------------------ ----------------------------------------------------------------
        22 [email protected] (TNS V1-V3)         prodney
The USER session variable is always present, so this is a safe thing to do. But, what about SAW_SRC_PATH? This is the path in the Presentation Catalog of the analysis being executed. Let’s add this into the Connection Pool script, passing it through as the CLIENT_INFO:
-- Pass the Analysis name to CLIENT_INFO
call dbms_application_info.set_client_info(client_info=>'VALUEOF(NQ_SESSION.SAW_SRC_PATH)')
This works just fine for analyses within a dashboard, or standalone analyses that have been saved. But what about a new analysis that hasn’t been saved yet? Unfortunately the result is not pretty:
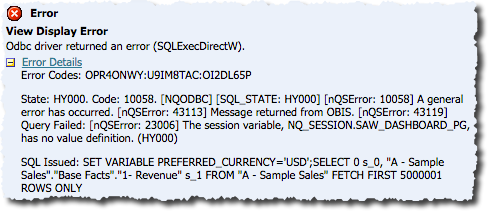
[10058][State: S1000] [NQODBC] [SQL_STATE: S1000] [nQSError: 10058] A general error has occurred.
[nQSError: 43113] Message returned from OBIS.
[nQSError: 43119] Query Failed:
[nQSError: 23006] The session variable, NQ_SESSION.SAW_SRC_PATH, has no value definition.
Statement execute failed
That’s because SAW_SRC_PATH is a request variable and since the analysis has not been saved Presentation Services does not pass it to BI Server as a request variable. The same holds true for SAW_DASHBOARD and SAW_DASHBOARD_PG if you run an analysis outside of a dashboard – the respective request variables are not set and hence the connection pool script causes the query itself to fail.
The way around this is we cheat, slightly. If you create a session variable with the names of these request variables that we want to use in the connection pool scripts then we avoid the above nasty failures. If the request variables are set then all is well, and if they are not then we fall back on whatever value we initialise the session variable with.
The final icing on the cake of the solution given above is a bit of string munging with INSTR and SUBSTR to convert and concatenate the dashboard path and page into a single string, so instead of :
/shared/01. QuickStart/_portal/1.30 Quickstart/Overview
we get:
1.30 Quickstart/Overview
Which is much easier on the eye when looking at dashboard names. Similarly with the analysis path we strip all but the last section of it.
Granular monitoring of OBIEE on the database
Once OBIEE has been configured to be more articulate in its connection to the database, it enables the use of DBMS_MONITOR to understand more about the performance of given dashboards, analyses, or queries for a given user. Through DBMS_MONITOR the collection of statistics such as DB time, DB CPU, and so can be triggered, as well as trace-file generation for queries matching the criteria specified.
As an example, here is switching on system statistics collection for just one dashboard in OBIEE, using SERV_MOD_ACT_STAT_ENABLE
call dbms_monitor.SERV_MOD_ACT_STAT_ENABLE(
    module_name=>'GCBC Dashboard/Overview'
    ,service_name=>'orcl'
);
Now Oracle stats to collect information whenever that particular dashboard is run, which we can use to understand more about how it is performing from a database point of view:
SYS@orcl AS SYSDBA> select module,stat_name,value from V$SERV_MOD_ACT_STATS;

MODULE                   STAT_NAME                           VALUE
------------------------ ------------------------------ ----------
GCBC Dashboard/Overview  user calls                             60
GCBC Dashboard/Overview  DB time                              6789
GCBC Dashboard/Overview  DB CPU                               9996
GCBC Dashboard/Overview  parse count (total)                    15
GCBC Dashboard/Overview  parse time elapsed                    476
GCBC Dashboard/Overview  execute count                          15
GCBC Dashboard/Overview  sql execute elapsed time             3887
[...]
Similarly the CLIENT_IDENTIFIER field can be used to collect statistics with CLIENT_ID_STAT_ENABLE or trigger trace file generation with CLIENT_ID_TRACE_ENABLE. What you populate CLIENT_IDENTIFIER with it up to you - by default the script I’ve detailed at the top of this article inserts the OBIEE username in it, but you may want to put the analysis here if that’s of more use from a diagnostics point of view on the database side. The CLIENT_INFO field is still available for the other item, but cannot be used with DBMS_MONITOR for identifying queries.
