Analysing ODI performance with Flame Graphs

Flame Graphs are a visualisation that I learnt about through the excellent Linux systems performance work of Brendan Gregg, and saw Luca Canali talk about recently at UKOUG Tech 14. They’re a brilliant way of summarising extremely dense information in a way from which the main components accounting for the most time can be identified. I was recently doing some analysis for a client on their ODI batch runtime and I thought it would be a good idea to try them out. Load Plans can have complex hierarchies to them and working out which main sections account for what time can be tricky, as can following a load plan step through to a session and on to a session step and its constituent parts.
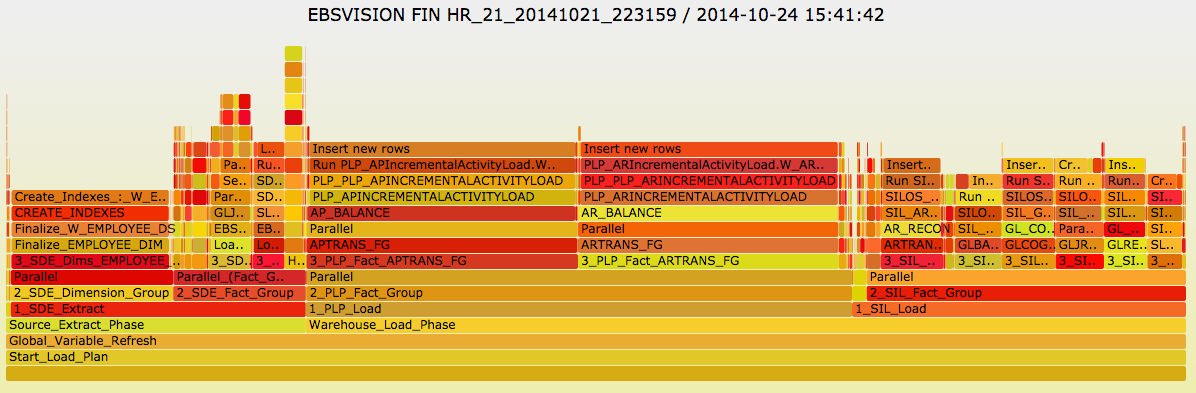
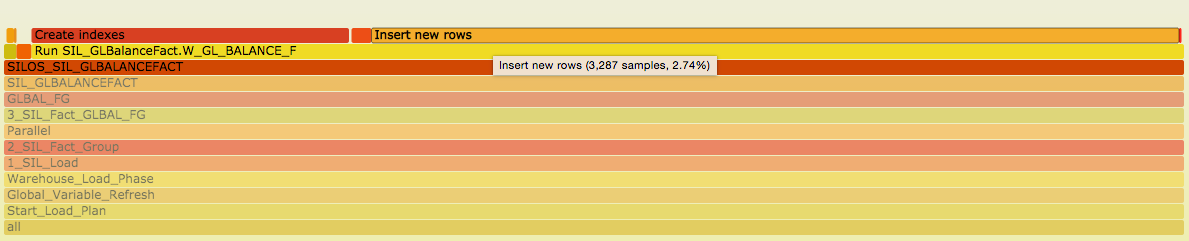
Looking at the flame graph above (taken from a demo BI Apps implementation) it’s nice and easy to see that the Warehouse Load Phase accounts for c.75% of the time, within which the two areas accounting for most time are AP and AR balances. This is from literally a single glance at one graphic. Flame Graphs are built as SVGs which enables them to be interactive (here's an example). Clicking on any of the stack trace boxes drills into that area, so for the tasks taking less time (and so displaying less text) this is useful to see the specifics. Here’s the GL balance load in detail, showing how long the row inserts take in proportion to the index build:
Creating the flame graph is simple. You just need a stack trace that is semi-colon separated, followed by a space-delimited counter value at the end. A bit of recursive SQL magic with the SNP_ tables (helpfully documented by Oracle here) gives us this kind of output file with one line for every task executed and its duration:
;Start_Load_Plan;Global_Variable_Refresh;Source_Extract_Phase;1_General;2_General_PRE-SDE;3_PRE-SDE_Day;Finalize_Day;Finalize_W_DAY_D;CREATE_INDEXES;Create_Indexes_:_W_DAY_D_2/2;EXEC_TABLE_MAINT_PROC;TABLE_MAINT_PROC;Create Indexes 3
[...]
which you then run through the Flame Graph tool:
cat /tmp/odi.out |~/git/FlameGraph/flamegraph.pl --title "EBSVISION FIN HR_21_20141021_223159 / 2014-10-24 15:41:42" > /tmp/odi-flame-graph.svg
Simply load the resulting SVG into a web browser such as Chrome, and you’re done. Here’s an example that you can download and try out.