Forays into Kafka - Enabling Flexible Data Pipelines
One of the defining features of “Big Data” from a technologist’s point of view is the sheer number of tools and permutations at one’s disposal. Do you go Flume or Logstash? Avro or Thrift? Pig or Spark? Foo or Bar? (I made that last one up). This wealth of choice is wonderful because it means we can choose the right tool for the right job each time.
Of course, we need to establish that have indeed chosen the right tool for the right job. But here’s the paradox. How do we easily work out if a tool is going to do what we want of it and is going to be a good fit, without disturbing what we already have in place? Particularly if it’s something that’s going to be part of an existing Productionised data pipeline, inserting a new tool partway through what’s there already is going to risk disrupting that. We potentially end up with a series of cloned environments, all diverging from each other, and not necessarily comparable (not to mention the overhead of the resource to host it all).
The same issue arises when we want to change the code or configuration of an existing pipeline. Bugs creep in, ideas to enhance the processing that you’ve currently got present themselves. Wouldn’t it be great if we could test these changes reliably and with no risk to the existing system?
This is where Kafka comes in. Kafka is very useful for two reasons:
- You can use it as a buffer for data that can be consumed and re-consumed on demand
- Multiple consumers can all pull the data, independently and at their own rate.
So you take your existing pipeline, plumb in Kafka, and then as and when you want to try out additional tools (or configurations of existing ones) you simply take another ‘tap’ off the existing store. This is an idea that Gwen Shapira put forward in May 2015 and really resonated with me.
I see Kafka sitting right on that Execution/Innovation demarcation line of the Information Management and Big Data Reference Architecture that Oracle and Rittman Mead produced last year:
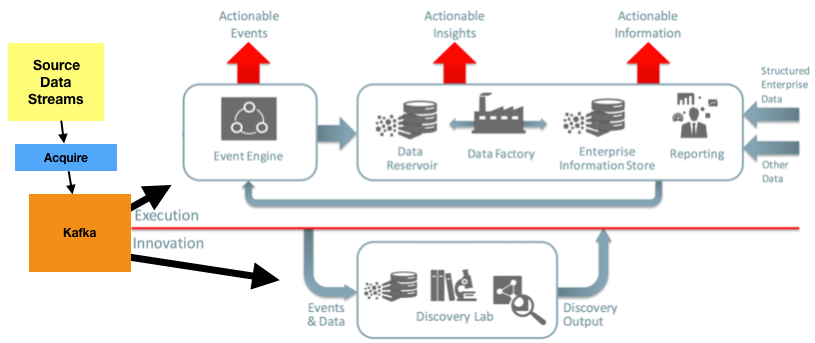
Kafka enables us to build a pipeline for our analytics that breaks down into two phases:
- Data ingest from source into Kafka, simple and reliable. Fewest moving parts as possible.
- Post-processing. Batch or realtime. Uses Kafka as source. Re-runnable. Multiple parallel consumers: -
- Productionised processing into Event Engine, Data Reservoir and beyond
- Adhoc/loosely controlled Data Discovery processing and re-processing
These two steps align with the idea of “Obtain” and “Scrub” that Rittman Mead’s Jordan Meyer talked about in his BI Forum 2015 Masterclass about the Data Discovery:

So that's the theory - let’s now look at an example of how Kafka can enable us to build a more flexible and productive data pipeline and environment.
Flume or Logstash? HDFS or Elasticsearch? … All of them!
Mark Rittman wrote back in April 2014 about using Apache Flume to stream logs from the Rittman Mead web server over to HDFS, from where they could be analysed in Hive and Impala. The basic setup looked like this:

Another route for analysing data is through the ELK stack. It does a similar thing - streams logs (with Logstash) in to a data store (Elasticsearch) from where they can be analysed, just with a different set of tools with a different emphasis on purpose. The input is the same - the web server log files. Let’s say I want to evaluate which is the better mechanism for analysing my log files, and compare the two side-by-side. Ultimately I might only want to go forward with one, but for now, I want to try both.
I could run them literally in parallel:

The disadvantage with this is that I have twice the ‘footprint’ on my data source, a Production server. A principle throughout all of this is that we want to remain light-touch on the sources of data. Whether a Production web server, a Production database, or whatever – upsetting the system owners of the data we want is never going to win friends.
An alternative to running in parallel would be to use one of the streaming tools to load data in place of the other, i.e.

or

The issue with this is I want to validate the end-to-end pipeline. Using a single source is better in terms of load/risk to the source system, but less so for validating my design. If I’m going to go with Elasticsearch as my target, Logstash would be the better fit source. Ditto HDFS/Flume. Both support connectors to the other, but using native capabilities always feels to me a safer option (particularly in the open-source world). And what if the particular modification I’m testing doesn’t support this kind of connectivity pattern?
Can you see where this is going? How about this:

The key points here are:
- One hit on the source system. In this case it’s flume, but it could be logstash, or another tool. This streams each line of the log file into Kafka in the exact order that it’s read.
- Kafka holds a copy of the log data, for a configurable time period. This could be days, or months - up to you and depending on purpose (and disk space!)
- Kafka is designed to be distributed and fault-tolerant. As with most of the boxes on this logical diagram it would be physically spread over multiple machines for capacity, performance, and resilience.
- The eventual targets, HDFS and Elasticsearch, are loaded by their respective tools pulling the web server entries exactly as they were on disk. In terms of validating end-to-end design we’re still doing that - we’re just pulling from a different source.
Another massively important benefit of Kafka is this:

Sooner or later (and if you’re new to the tool and code/configuration required, probably sooner) you’re going to get errors in your data pipeline. These may be fatal and cause it to fall in a heap, or they may be more subtle and you only realise after analysis that some of your data’s missing or not fully enriched. What to do? Obviously you need to re-run your ingest process. But how easy is that? Where is the source data? Maybe you’ll have a folder full of “.processed” source log files, or an HDFS folder of raw source data that you can reprocess. The issue here is the re-processing - you need to point your code at the alternative source, and work out the range of data to reprocess.
This is all eminently do-able of course – but wouldn’t it be easier just to rerun your existing ingest pipeline and just rewind the point at which it’s going to pull data from? Minimising the amount of ‘replumbing’ and reconfiguration to run a re-process job vs. new ingest makes it faster to do, and more reliable. Each additional configuration change is an opportunity to mis-configure. Each ‘shadow’ script clone for re-running vs normal processing is increasing the risk of code diverging and stale copies being run.
The final pipeline in this simple example looks like this:

- The source server logs are streamed into Kafka, with a permanent copy up onto Amazon’s S3 for those real “uh oh” moments. Kafka, in a sandbox environment with a ham-fisted sysadmin, won’t be bullet-proof. Better to recover a copy from S3 than have to bother the Production server again. This is something I've put in for this specific use case, and wouldn't be applicable in others.
- From Kafka the web server logs are available to stream, as if natively from the web server disk itself, through Flume and Logstash.
There’s a variation on a theme of this, that looks like this:

Instead of Flume -> Kafka, and then a second Flume -> HDFS, we shortcut this and have the same Flume agent as is pulling from source writing to HDFS. Why have I not put this as the final pipeline? Because of this:

Let's say that I want to do some kind of light-touch enrichment on the files, such as extracting the log timestamp in order to partition my web server logs in HDFS by the date of the log entry (not the time of processing, because I’m working with historical files too). I’m using a regex_extractor interceptor in Flume to determine the timestamp from the event data (log entry) being processed. That’s great, and it works well – when it works. If I get my regex wrong, or the log file changes date format, the house of cards comes tumbling down. Now I have a mess, because my nice clean ingest pipeline from the source system now needs fixing and re-running. As before, of course it is possible to write this cleanly so that it doesn’t break, etc etc, but from the point of view of decoupling operations for manageability and flexibility it makes sense to keep them separate (remember the Obtain vs Scrub point above?).
The final note on this is to point out that technically we can implement the pipeline using a Kafka Flume channel, which is a slightly neater way of doing things. The data still ends up in the S3 sink, and available in Kafka for streaming to all the consumers.

Kafka in Action
Let’s take a look at the configuration to put the above theory into practice. I’m running all of this on Oracle’s BigDataLite 4.2.1 VM which includes, amongst many other goodies, CDH 5.4.0. Alongside this I’ve installed into /opt :
- apache-flume-1.6.0
- elasticsearch-1.7.3
- kafka_2.10-0.8.2.1
- kibana-4.1.2-linux-x64
- logstash-1.5.4
The Starting Point - Flume -> HDFS
First, we’ve got the initial Logs -> Flume -> HDFS configuration, similar to what Mark wrote about originally:

# http://flume.apache.org/FlumeUserGuide.html#exec-source
source_agent.sources = apache_server
source_agent.sources.apache_server.type = exec
source_agent.sources.apache_server.command = tail -f /home/oracle/website_logs/access_log
source_agent.sources.apache_server.batchSize = 1
source_agent.sources.apache_server.channels = memoryChannel

# http://flume.apache.org/FlumeUserGuide.html#memory-channel
source_agent.channels = memoryChannel
source_agent.channels.memoryChannel.type = memory
source_agent.channels.memoryChannel.capacity = 100

## Write to HDFS
source_agent.sinks = hdfs_sink
source_agent.sinks.hdfs_sink.type = hdfs
source_agent.sinks.hdfs_sink.channel = memoryChannel
source_agent.sinks.hdfs_sink.hdfs.path = /user/oracle/incoming/rm_logs/apache_log
source_agent.sinks.hdfs_sink.hdfs.fileType = DataStream
source_agent.sinks.hdfs_sink.hdfs.writeFormat = Text
source_agent.sinks.hdfs_sink.hdfs.rollSize = 0
source_agent.sinks.hdfs_sink.hdfs.rollCount = 10000
source_agent.sinks.hdfs_sink.hdfs.rollInterval = 600
After running this
$ /opt/apache-flume-1.6.0-bin/bin/flume-ng agent --name source_agent \
--conf-file flume_website_logs_02_tail_source_hdfs_sink.conf
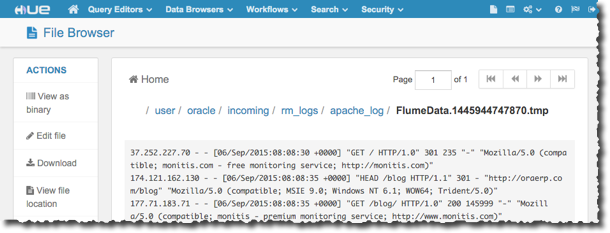
we get the logs appearing in HDFS and can see them easily in Hue:
Adding Kafka to the Pipeline
Let’s now add Kafka to the mix. I’ve already set up and started Kafka (see here for how), and Zookeeper’s already running as part of the default BigDataLite build.
First we need to define a Kafka topic that is going to hold the log files. In this case it’s called apache_logs:
$ /opt/kafka_2.10-0.8.2.1/bin/kafka-topics.sh --zookeeper bigdatalite:2181 \
--create --topic apache_logs  --replication-factor 1 --partitions 1
Just to prove it’s there and we can send/receive message on it I’m going to use the Kafka console producer/consumer to test it. Run these in two separate windows:
$ /opt/kafka_2.10-0.8.2.1/bin/kafka-console-producer.sh \
--broker-list bigdatalite:9092 --topic apache_logs
$ /opt/kafka_2.10-0.8.2.1/bin/kafka-console-consumer.sh \
--zookeeper bigdatalite:2181 --topic apache_logs
With the Consumer running enter some text, any text, in the Producer session and you should see it appear almost immediately in the Consumer window.
Now that we’ve validated the Kafka topic, let’s plumb it in. We’ll switch the existing Flume config to use a Kafka sink, and then add a second Flume agent to do the Kafka -> HDFS bit, giving us this:

The original flume agent configuration now looks like this:
source_agent.sources = apache_log_tail
source_agent.channels = memoryChannel
source_agent.sinks = kafka_sink

# http://flume.apache.org/FlumeUserGuide.html#exec-source
source_agent.sources.apache_log_tail.type = exec
source_agent.sources.apache_log_tail.command = tail -f /home/oracle/website_logs/access_log
source_agent.sources.apache_log_tail.batchSize = 1
source_agent.sources.apache_log_tail.channels = memoryChannel

# http://flume.apache.org/FlumeUserGuide.html#memory-channel
source_agent.channels.memoryChannel.type = memory
source_agent.channels.memoryChannel.capacity = 100

## Write to Kafka
source_agent.sinks.kafka_sink.channel = memoryChannel
source_agent.sinks.kafka_sink.type = org.apache.flume.sink.kafka.KafkaSink
source_agent.sinks.kafka_sink.batchSize = 5
source_agent.sinks.kafka_sink.brokerList = bigdatalite:9092
source_agent.sinks.kafka_sink.topic = apache_logs
Restart the kafka-console-consumer.sh from above so that you can see what’s going into Kafka, and then run the Flume agent. You should see the log entries appearing soon after. Remember that kafka-console-consumer.sh is just one consumer of the logs - when we plug in the Flume consumer to write the logs to HDFS we can opt to pick up all of the entries in Kafka, completely independently of what we have or haven’t consumed in kafka-console-consumer.sh.
$ /opt/apache-flume-1.6.0-bin/bin/flume-ng agent --name source_agent \
--conf-file flume_website_logs_03_tail_source_kafka_sink.conf
[oracle@bigdatalite ~]$ /opt/kafka_2.10-0.8.2.1/bin/kafka-console-consumer.sh \
--zookeeper bigdatalite:2181 --topic apache_logs

37.252.227.70 - - [06/Sep/2015:08:08:30 +0000] "GET / HTTP/1.0" 301 235 "-" "Mozilla/5.0 (compatible; monitis.com - free monitoring service; http://monitis.com)"
174.121.162.130 - - [06/Sep/2015:08:08:35 +0000] "HEAD /blog HTTP/1.1" 301 - "http://oraerp.com/blog" "Mozilla/5.0 (compatible; MSIE 9.0; Windows NT 6.1; WOW64; Trident/5.0)"
177.71.183.71 - - [06/Sep/2015:08:08:35 +0000] "GET /blog/ HTTP/1.0" 200 145999 "-" "Mozilla/5.0 (compatible; monitis - premium monitoring service; http://www.monitis.com)"
174.121.162.130 - - [06/Sep/2015:08:08:36 +0000] "HEAD /blog/ HTTP/1.1" 200 - "http://oraerp.com/blog" "Mozilla/5.0 (compatible; MSIE 9.0; Windows NT 6.1; WOW64; Trident/5.0)"
173.192.34.91 - - [06/Sep/2015:08:08:44 +0000] "GET / HTTP/1.0" 301 235 "-" "Mozilla/5.0 (compatible; monitis.com - free monitoring service; http://monitis.com)"
217.146.9.53 - - [06/Sep/2015:08:08:58 +0000] "GET / HTTP/1.0" 301 235 "-" "Mozilla/5.0 (compatible; monitis - premium monitoring service; http://www.monitis.com)"
82.47.31.235 - - [06/Sep/2015:08:08:58 +0000] "GET / HTTP/1.1" 200 36946 "-" "Echoping/6.0.2"
Set up the second Flume agent to use Kafka as a source, and HDFS as the target just as it was before we added Kafka into the pipeline:
target_agent.sources = kafkaSource
target_agent.channels = memoryChannel
target_agent.sinks = hdfsSink

target_agent.sources.kafkaSource.type = org.apache.flume.source.kafka.KafkaSource
target_agent.sources.kafkaSource.zookeeperConnect = bigdatalite:2181
target_agent.sources.kafkaSource.topic = apache_logs
target_agent.sources.kafkaSource.batchSize = 5
target_agent.sources.kafkaSource.batchDurationMillis = 200
target_agent.sources.kafkaSource.channels = memoryChannel

# http://flume.apache.org/FlumeUserGuide.html#memory-channel
target_agent.channels.memoryChannel.type = memory
target_agent.channels.memoryChannel.capacity = 100

## Write to HDFS
#http://flume.apache.org/FlumeUserGuide.html#hdfs-sink
target_agent.sinks.hdfsSink.type = hdfs
target_agent.sinks.hdfsSink.channel = memoryChannel
target_agent.sinks.hdfsSink.hdfs.path = /user/oracle/incoming/rm_logs/apache_log
target_agent.sinks.hdfsSink.hdfs.fileType = DataStream
target_agent.sinks.hdfsSink.hdfs.writeFormat = Text
target_agent.sinks.hdfsSink.hdfs.rollSize = 0
target_agent.sinks.hdfsSink.hdfs.rollCount = 10000
target_agent.sinks.hdfsSink.hdfs.rollInterval = 600
Fire up the agent:
$ /opt/apache-flume-1.6.0-bin/bin/flume-ng agent -n target_agent \
-f flume_website_logs_04_kafka_source_hdfs_sink.conf
and as the website log data streams in to Kafka (from the first Flume agent) you should see the second Flume agent sending it to HDFS and evidence of this in the console output from Flume:
15/10/27 13:53:53 INFO hdfs.BucketWriter: Creating /user/oracle/incoming/rm_logs/apache_log/FlumeData.1445954032932.tmp
and in HDFS itself:

Play it again, Sam?
All we’ve done to this point is add Kafka into the pipeline, ready for subsequent use. We’ve not changed the nett output of the data pipeline. But, we can now benefit from having Kafka there, by re-running some of our HDFS load without having to go back to the source files. Let’s say we want to partition the logs as we store them. But, we don’t want to disrupt the existing processing. How? Easy! Just create another Flume agent with the additional configuration in to do the partitioning.

target_agent.sources = kafkaSource
target_agent.channels = memoryChannel
target_agent.sinks = hdfsSink

target_agent.sources.kafkaSource.type = org.apache.flume.source.kafka.KafkaSource
target_agent.sources.kafkaSource.zookeeperConnect = bigdatalite:2181
target_agent.sources.kafkaSource.topic = apache_logs
target_agent.sources.kafkaSource.batchSize = 5
target_agent.sources.kafkaSource.batchDurationMillis = 200
target_agent.sources.kafkaSource.channels = memoryChannel
target_agent.sources.kafkaSource.groupId = new
target_agent.sources.kafkaSource.kafka.auto.offset.reset = smallest
target_agent.sources.kafkaSource.interceptors = i1

# http://flume.apache.org/FlumeUserGuide.html#memory-channel
target_agent.channels.memoryChannel.type = memory
target_agent.channels.memoryChannel.capacity = 1000

# Regex Interceptor to set timestamp so that HDFS can be written to partitioned
target_agent.sources.kafkaSource.interceptors.i1.type = regex_extractor
target_agent.sources.kafkaSource.interceptors.i1.serializers = s1
target_agent.sources.kafkaSource.interceptors.i1.serializers.s1.type = org.apache.flume.interceptor.RegexExtractorInterceptorMillisSerializer
target_agent.sources.kafkaSource.interceptors.i1.serializers.s1.name = timestamp
#
# Match this format logfile to get timestamp from it:
# 76.164.194.74 - - [06/Apr/2014:03:38:07 +0000] "GET / HTTP/1.1" 200 38281 "-" "Pingdom.com_bot_version_1.4_(http://www.pingdom.com/)"
target_agent.sources.kafkaSource.interceptors.i1.regex = (\\d{2}\\/[a-zA-Z]{3}\\/\\d{4}:\\d{2}:\\d{2}:\\d{2}\\s\\+\\d{4})
target_agent.sources.kafkaSource.interceptors.i1.serializers.s1.pattern = dd/MMM/yyyy:HH:mm:ss Z
#

## Write to HDFS
#http://flume.apache.org/FlumeUserGuide.html#hdfs-sink
target_agent.sinks.hdfsSink.type = hdfs
target_agent.sinks.hdfsSink.channel = memoryChannel
target_agent.sinks.hdfsSink.hdfs.path = /user/oracle/incoming/rm_logs/apache/%Y/%m/%d/access_log
target_agent.sinks.hdfsSink.hdfs.fileType = DataStream
target_agent.sinks.hdfsSink.hdfs.writeFormat = Text
target_agent.sinks.hdfsSink.hdfs.rollSize = 0
target_agent.sinks.hdfsSink.hdfs.rollCount = 0
target_agent.sinks.hdfsSink.hdfs.rollInterval = 600
The important lines of note here (as highlighted above) are:
- the regex_extractor interceptor which determines the timestamp of the log event, then used in the hdfs.path partitioning structure
- the groupId and kafka.auto.offset.reset configuration items for the kafkaSource.
- The groupId ensures that this flume agent’s offset in the consumption of the data in the Kafka topic is maintained separately from that of the original agent that we had. By default it is
flume, and here I'm overriding it tonew. It’s a good idea to specify this explicitly in all Kafka flume consumer configurations to avoid complications. - kafka.auto.offset.reset tells the consumer that if no existing offset is found (which is won’t be, if the groupId is new one) to start from the beginning of the data rather than the end (which is what it will do by default).
- Thus if you want to get Flume to replay the contents of a Kafka topic, just set the groupId to an unused one (eg ‘foo01’, ‘foo02’, etc) and make sure the kafka.auto.offset.reset is smallest
- The groupId ensures that this flume agent’s offset in the consumption of the data in the Kafka topic is maintained separately from that of the original agent that we had. By default it is
Now run it (concurrently with the existing flume agents if you want):
$ /opt/apache-flume-1.6.0-bin/bin/flume-ng agent -n target_agent \
-f flume_website_logs_07_kafka_source_partitioned_hdfs_sink.conf
You should see a flurry of activity (or not, depending on how much data you’ve already got in Kafka), and some nicely partitioned apache logs in HDFS:
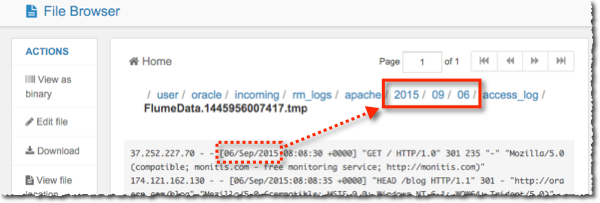
Crucially, the existing flume agent and non-partitioned HDFS pipeline stays in place and functioning exactly as it was - we’ve not had to touch it. We could then run two two side-by-side until we’re happy the partitioning is working correctly and then decommission the first. Even at this point we have the benefit of Kafka, because we just turn off the original HDFS-writing agent - the new “live” one continues to run, it doesn’t need reconfiguring. We’ve validated the actual configuration we’re going to use for real, we’ve not had to simulate it up with mock data sources that then need re-plumbing prior to real use.
Clouds and Channels
We’re going to evolve the pipeline a bit now. We’ll go back to a single Flume agent writing to HDFS, but add in Amazon’s S3 as the target for the unprocessed log files. The point here is not so much that S3 is the best place to store log files (although it is a good option), but as a way to demonstrate a secondary method of keeping your raw data available without impacting the source system. It also fits nicely with using the Kafka flume channel to tighten the pipeline up a tad:

Amazon’s S3 service is built on HDFS itself, and Flume can use the S3N protocol to write directly to it. You need to have already set up your S3 ‘bucket’, and have the appropriate AWS Access Key ID and Secret Key. To get this to work I added these credentials to /etc/hadoop/conf.bigdatalite/core-site.xml (I tried specifying them inline with the flume configuration but with no success):
<property>
    <name>fs.s3n.awsAccessKeyId</name>
    <value>XXXXXXXXXXXXX</value>
</property>
<property>
    <name>fs.s3n.awsSecretAccessKey</name>
    <value>YYYYYYYYYYYYYYYYYYYY</value>
</property>
Once you’ve set up the bucket and credentials, the original flume agent (the one pulling the actual web server logs) can be amended:
source_agent.sources = apache_log_tail
source_agent.channels = kafkaChannel
source_agent.sinks = s3Sink

# http://flume.apache.org/FlumeUserGuide.html#exec-source
source_agent.sources.apache_log_tail.type = exec
source_agent.sources.apache_log_tail.command = tail -f /home/oracle/website_logs/access_log
source_agent.sources.apache_log_tail.batchSize = 1
source_agent.sources.apache_log_tail.channels = kafkaChannel


## Write to Kafka Channel
source_agent.channels.kafkaChannel.channel = kafkaChannel
source_agent.channels.kafkaChannel.type = org.apache.flume.channel.kafka.KafkaChannel
source_agent.channels.kafkaChannel.topic = apache_logs
source_agent.channels.kafkaChannel.brokerList = bigdatalite:9092
source_agent.channels.kafkaChannel.zookeeperConnect = bigdatalite:2181

## Write to S3
source_agent.sinks.s3Sink.channel = kafkaChannel
source_agent.sinks.s3Sink.type = hdfs
source_agent.sinks.s3Sink.hdfs.path = s3n://rmoff-test/apache
source_agent.sinks.s3Sink.hdfs.fileType = DataStream
source_agent.sinks.s3Sink.hdfs.filePrefix = access_log
source_agent.sinks.s3Sink.hdfs.writeFormat = Text
source_agent.sinks.s3Sink.hdfs.rollCount = 10000
source_agent.sinks.s3Sink.hdfs.rollSize = 0
source_agent.sinks.s3Sink.hdfs.batchSize = 10000
source_agent.sinks.s3Sink.hdfs.rollInterval = 600
Here the source is the same as before (server logs), but the channel is now Kafka itself, and the sink S3. Using Kafka as the channel has the nice benefit that the data is now already in Kafka, we don’t need that as an explicit target in its own right.
Restart the source agent using this new configuration:
$ /opt/apache-flume-1.6.0-bin/bin/flume-ng agent --name source_agent \
--conf-file flume_website_logs_09_tail_source_kafka_channel_s3_sink.conf
and you should get the data appearing on both HDFS as before, and now also in the S3 bucket:

Didn’t Someone Say Logstash?
The premise at the beginning of this exercise was that I could extend an existing data pipeline to pull data into a new set of tools, as if from the original source, but without touching that source or the existing configuration in place. So far we’ve got a pipeline that is pretty much as we started with, just with Kafka in there now and an additional feed to S3:

Now we’re going to extend (or maybe “broaden” is a better term) the data pipeline to add Elasticsearch into it:

Whilst Flume can write to Elasticsearch given the appropriate extender, I’d rather use a tool much closer to Elasticsearch in origin and direction – Logstash. Logstash supports Kafka as an input (and an output, if you want), making the configuration ridiculously simple. To smoke-test the configuration just run Logstash with this configuration:
input {
        kafka {
                zk_connect => 'bigdatalite:2181'
                topic_id => 'apache_logs'
                codec => plain {
                        charset => "ISO-8859-1"
                }
                # Use both the following two if you want to reset processing
                reset_beginning => 'true'
                auto_offset_reset => 'smallest'

        }
}

output {
        stdout {codec => rubydebug }
        }
A few of things to point out in the input configuration:
- You need to specify plain codec (assuming your input from Kafka is). The default codec for the Kafka plugin is json, and Logstash does NOT like trying to parse plain text and json as I found out:
37.252.227.70 - - [06/Sep/2015:08:08:30 +0000] "GET / HTTP/1.0" 301 235 "-" "Mozilla/5.0 (compatible; monitis.com - free monitoring service; http://monitis.com)" {:exception=>#<NoMethodError: undefined method `[]' for 37.252:Float>, :backtrace=>["/opt/logstash-1.5.4/vendor/bundle/jruby/1.9/gems/logstash-core-1.5.4-java/lib/logstash/event.rb:73:in `initialize'", "/opt/logstash-1.5.4/vendor/bundle/jruby/1.9/gems/logstash-codec-json-1.0.1/lib/logstash/codecs/json.rb:46:in `decode'", "/opt/logstash-1.5.4/vendor/bundle/jruby/1.9/gems/logstash-input-kafka-1.0.0/lib/logstash/inputs/kafka.rb:169:in `queue_event'", "/opt/logstash-1.5.4/vendor/bundle/jruby/1.9/gems/logstash-input-kafka-1.0.0/lib/logstash/inputs/kafka.rb:139:in `run'", "/opt/logstash-1.5.4/vendor/bundle/jruby/1.9/gems/logstash-core-1.5.4-java/lib/logstash/pipeline.rb:177:in `inputworker'", "/opt/logstash-1.5.4/vendor/bundle/jruby/1.9/gems/logstash-core-1.5.4-java/lib/logstash/pipeline.rb:171:in `start_input'"], :level=>:error} - As well as specifying the codec, I needed to specify the charset. Without this I got
\\u0000\\xBA\\u0001at the beginning of each message that Logstash pulled from Kafka - Specifying reset_beginning and auto_offset_reset tell Logstash to pull everything in from Kafka, rather than starting at the latest offset.
When you run the configuration file above you should see a stream of messages to your console of everything that is in the Kafka topic:
$ /opt/logstash-1.5.4/bin/logstash -f logstash-apache_10_kafka_source_console_output.conf
The output will look like this - note that Logstash has added its own special @version and @timestamp fields:
{
       "message" => "203.199.118.224 - - [09/Oct/2015:04:13:23 +0000] \"GET /wp-content/uploads/2014/10/JFB-View-Selector-LowRes-300x218.png HTTP/1.1\" 200 53295 \"http://www.rittmanmead.com/blog/2014/10/obiee-how-to-a-view-selector-for-your-dashboard/\" \"Mozilla/5.0 (Windows NT 6.1; WOW64) AppleWebKit/537.36 (KHTML, like Gecko) Chrome/36.0.1985.143 Safari/537.36\"",
      "@version" => "1",
    "@timestamp" => "2015-10-27T17:29:06.596Z"
}
Having proven the Kafka-Logstash integration, let’s do something useful – get all those lovely log entries streaming from source, through Kafka, enriched in Logstash with things like geoip, and finally stored in Elasticsearch:
input {
        kafka {
                zk_connect => 'bigdatalite:2181'
                topic_id => 'apache_logs'
                codec => plain {
                        charset => "ISO-8859-1"
                }
                # Use both the following two if you want to reset processing
                reset_beginning => 'true'
                auto_offset_reset => 'smallest'
        }
}


filter {
        # Parse the message using the pre-defined "COMBINEDAPACHELOG" grok pattern
        grok { match => ["message","%{COMBINEDAPACHELOG}"] }

        # Ignore anything that's not a blog post hit, characterised by /yyyy/mm/post-slug form
        if [request] !~ /^\/[0-9]{4}\/[0-9]{2}\/.*$/ { drop{} }

        # From the blog post URL, strip out the year/month and slug
        #  http://www.rittmanmead.com/blog/2015/02/obiee-monitoring-and-diagnostics-with-influxdb-and-grafana/
        #     year  => 2015
        #     month =>   02
        #     slug  => obiee-monitoring-and-diagnostics-with-influxdb-and-grafana
        grok { match => [ "request","\/%{NUMBER:post-year}\/%{NUMBER:post-month}\/(%{NUMBER:post-day}\/)?%{DATA:post-slug}(\/.*)?$"] }

        # Combine year and month into one field
        mutate { replace => [ "post-year-month" , "%{post-year}-%{post-month}" ] }

        # Use GeoIP lookup to locate the visitor's town/country
        geoip { source => "clientip" }

        # Store the date of the log entry (rather than now) as the event's timestamp
        date { match => ["timestamp", "dd/MMM/yyyy:HH:mm:ss Z"]}
}

output {
        elasticsearch { host => "bigdatalite"  index => "blog-apache-%{+YYYY.MM.dd}"}
        }
Make sure that Elasticsearch is running and then kick off Logstash:
$ /opt/logstash-1.5.4/bin/logstash -f logstash-apache_01_kafka_source_parsed_to_es.conf
Nothing will appear to happen on the console:
log4j, [2015-10-27T17:36:53.228]  WARN: org.elasticsearch.bootstrap: JNA not found. native methods will be disabled.
Logstash startup completed
But in the background Elasticsearch will be filling up with lots of enriched log data. You can confirm this through the useful kopf plugin to see that the Elasticsearch indices are being created:
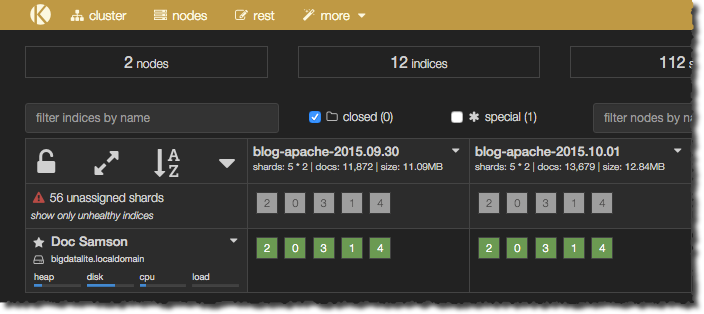
and directly through Elasticsearch’s RESTful API too:
$ curl -s -XGET http://bigdatalite:9200/_cat/indices?v|sort
health status index                  pri rep docs.count docs.deleted store.size pri.store.size
yellow open   blog-apache-2015.09.30   5   1      11872            0       11mb           11mb
yellow open   blog-apache-2015.10.01   5   1      13679            0     12.8mb         12.8mb
yellow open   blog-apache-2015.10.02   5   1      10042            0      9.6mb          9.6mb
yellow open   blog-apache-2015.10.03   5   1       8722            0      7.3mb          7.3mb
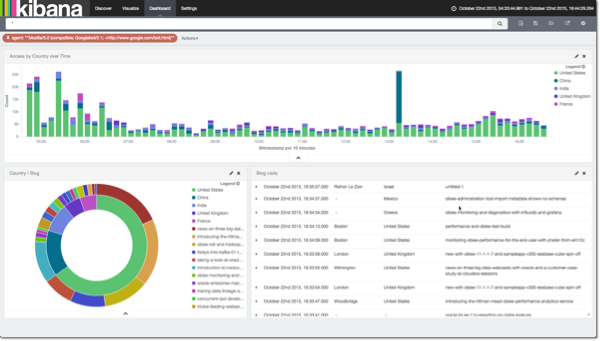
And of course, the whole point of streaming the data into Elasticsearch in the first place – easy analytics through Kibana:
Conclusion
Kafka is awesome :-D
We’ve seen in this article how Kafka enables the implementation of flexible data pipelines that can evolve organically without requiring system rebuilds to implement or test new methods. It allows the data discovery function to tap in to the same source of data as the more standard analytical reporting one, without risking impacting the source system at all.
