An Alternative Front-End for OBIEE using Web Services and D3

Working with OBIEE, it is common to get requests to add visualisations or otherwise improve the UI. Typically this has been done by using narrative views to embed HTML and Javascript to provide data driven, custom visualisations. To cope with the former, Tom Underhill developed the Rittman Mead Visual Plugin Pack (RMVPP), a web based plugin to allow configurable visualisations to work natively in OBIEE through the use of narratives. This technology is uses configurable Javascript templates for each plugin. Each plugin has a render function which will receive the dataset from OBIEE as well as any associated information. The features of the plugin are then only limited by the ability of the JS developer and current web standards. Plugin developers could be further aided by sharing common functions for display and data manipulation, and external libraries can be included simply.
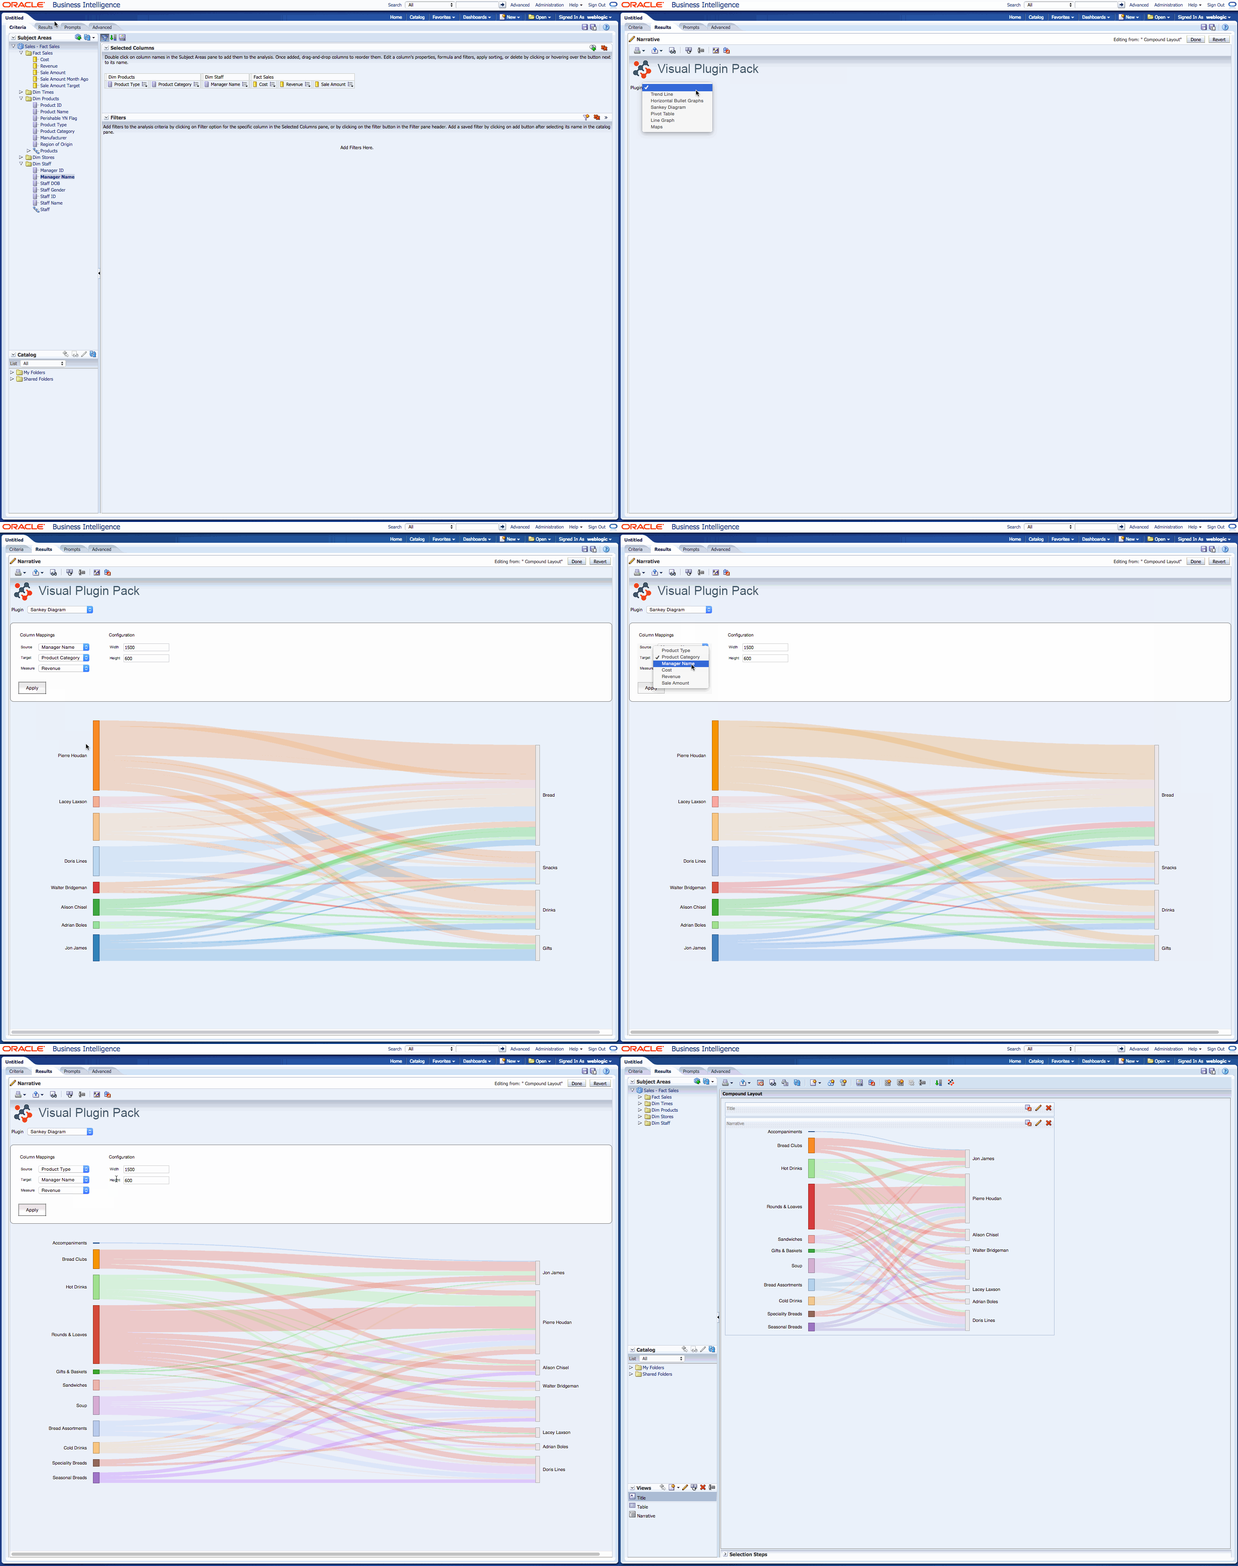
Above shows the process of creating a Sankey diagram using the RMVPP framework. The code then produces the corresponding narrative required to generate this visualisation automatically.
When RMVPP was being developed by Tom, I was investigating the use of web services in OBIEE. Several of us at Rittman Mead had used the exposed web services to interface with OBIEE to automate various tasks programmatically, such as regression testing and web catalogue auditing. A client had a requirement to execute an OBIEE query on a webpage outside of the OBIEE front end in order to power a fairly sophisticated 3JS application that was not rendering within OBIEE (via a narrative). It appeared that the shortcomings were due to attempting to render the WebGL within the complex div and table structure of an OBIEE page. Soon, I was able to use the web services client side, in Javascript (so long as the page was hosted on the same server as OBIEE) as opposed to server side in Python or similar. Combining this breakthrough with Tom's RMVPP framework seemed like the next logical step - as it would allow us to totally modify the OBIEE front end whilst retaining the benefits of using the BI Server like security and physical query generation.
An Alternative Front-end for OBIEE
The following section will describe and show some of the features I have developed in my alternative to the OBIEE front end. It uses the plugin framework from RMVPP but with a custom interface that works differently to OBIEE.
Creating a Visualisation
Below is a screencapture showing creation of a basic bar chart.
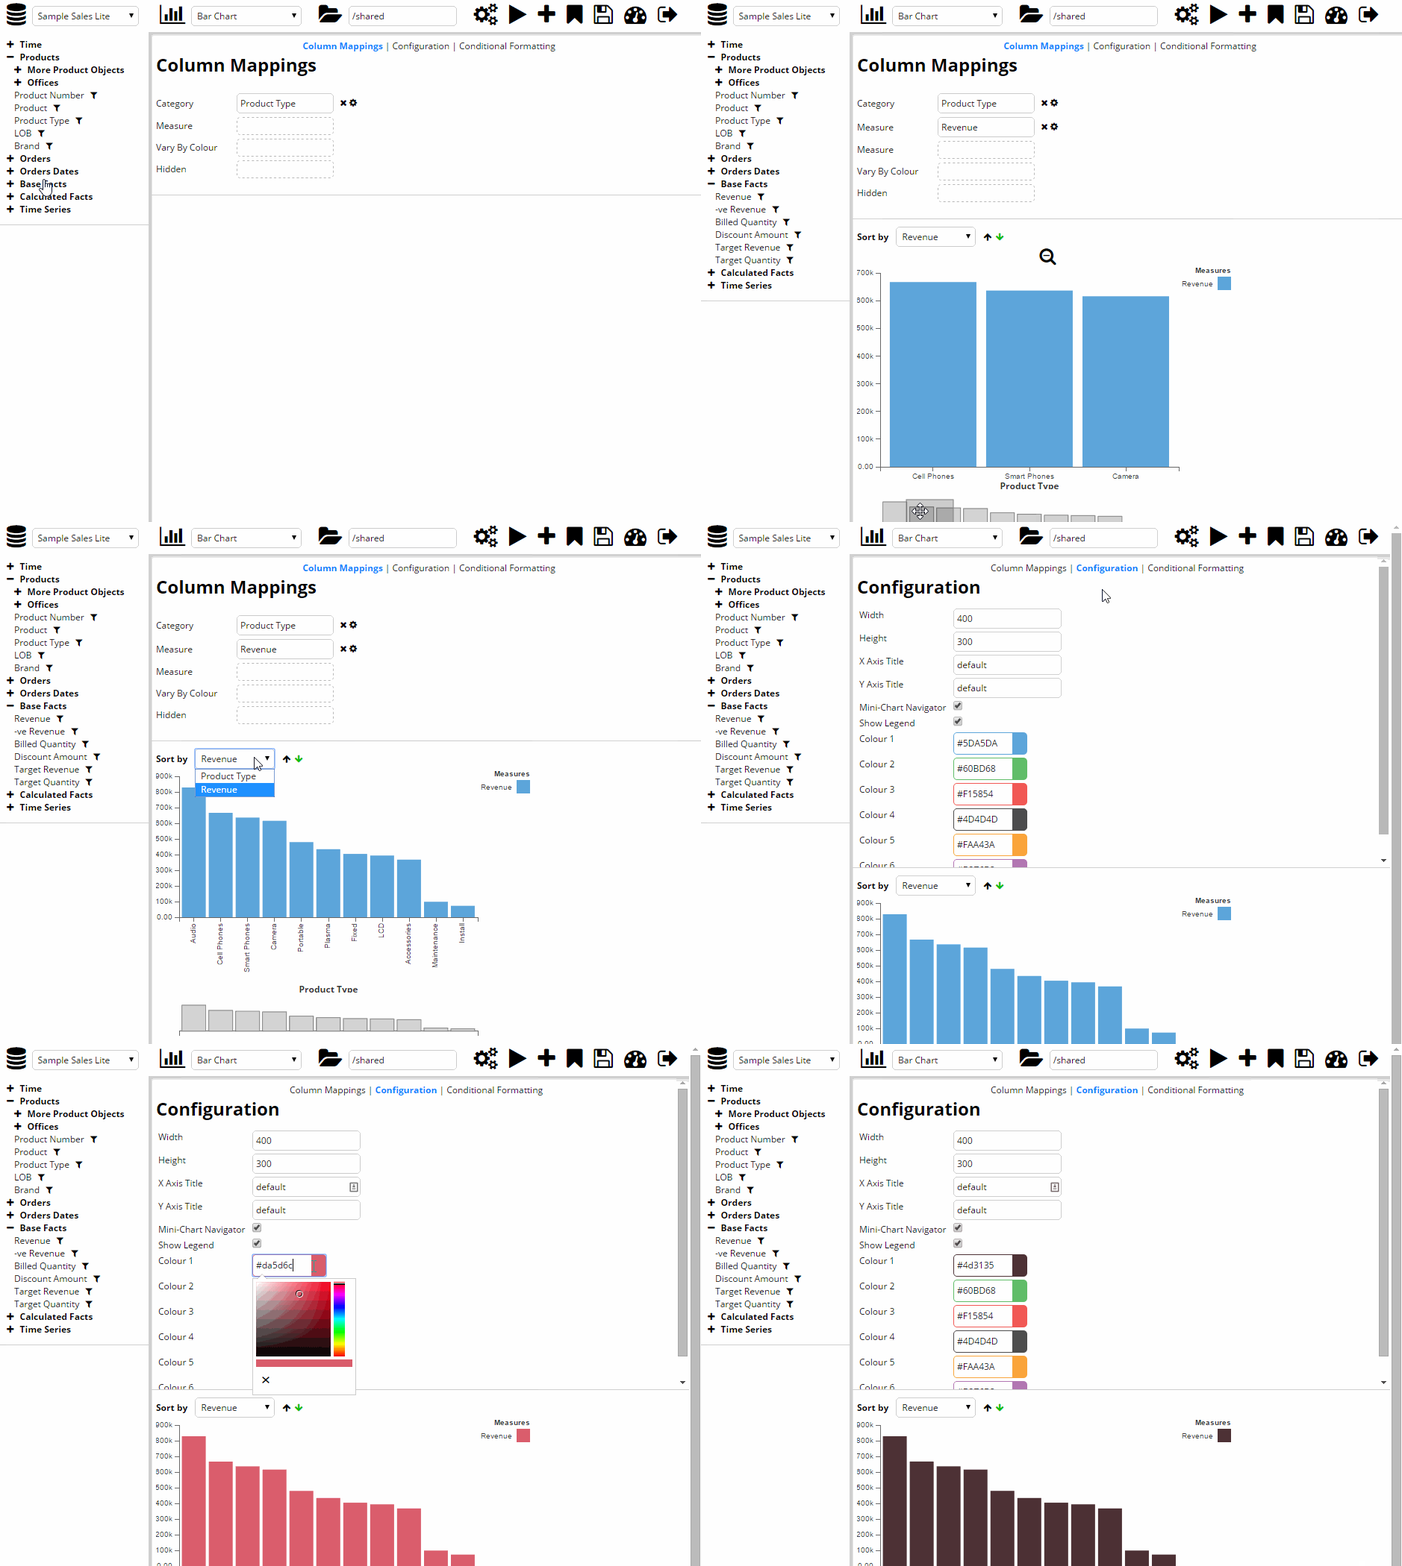
The column mapping tab is configurable by the plugin developer and specifies the parameters that each visualisation will use. As a user, OBIEE presentation columns (displayed on the left) are mapped into these parameters. A flag can be set on a parameter to allow multiple columns to be chosen for that parameter. The plugin developer can then use the resulting data set accordingly. The columns selected here are effectively the Criteria from vanilla OBIEE as they determine which columns are used in the logical SQL. The parameter mapping allow the developer to use the correct columns from the data set in the render function.
The configuration screen shown there is customisable by the plugin designer, allowing developers to specify a list of options and UI elements that get fed back into the render function for the visualisation. UI options include:
- Textboxes
- Dropdowns
- Radio Buttons
- Colour Pickers
Filtering
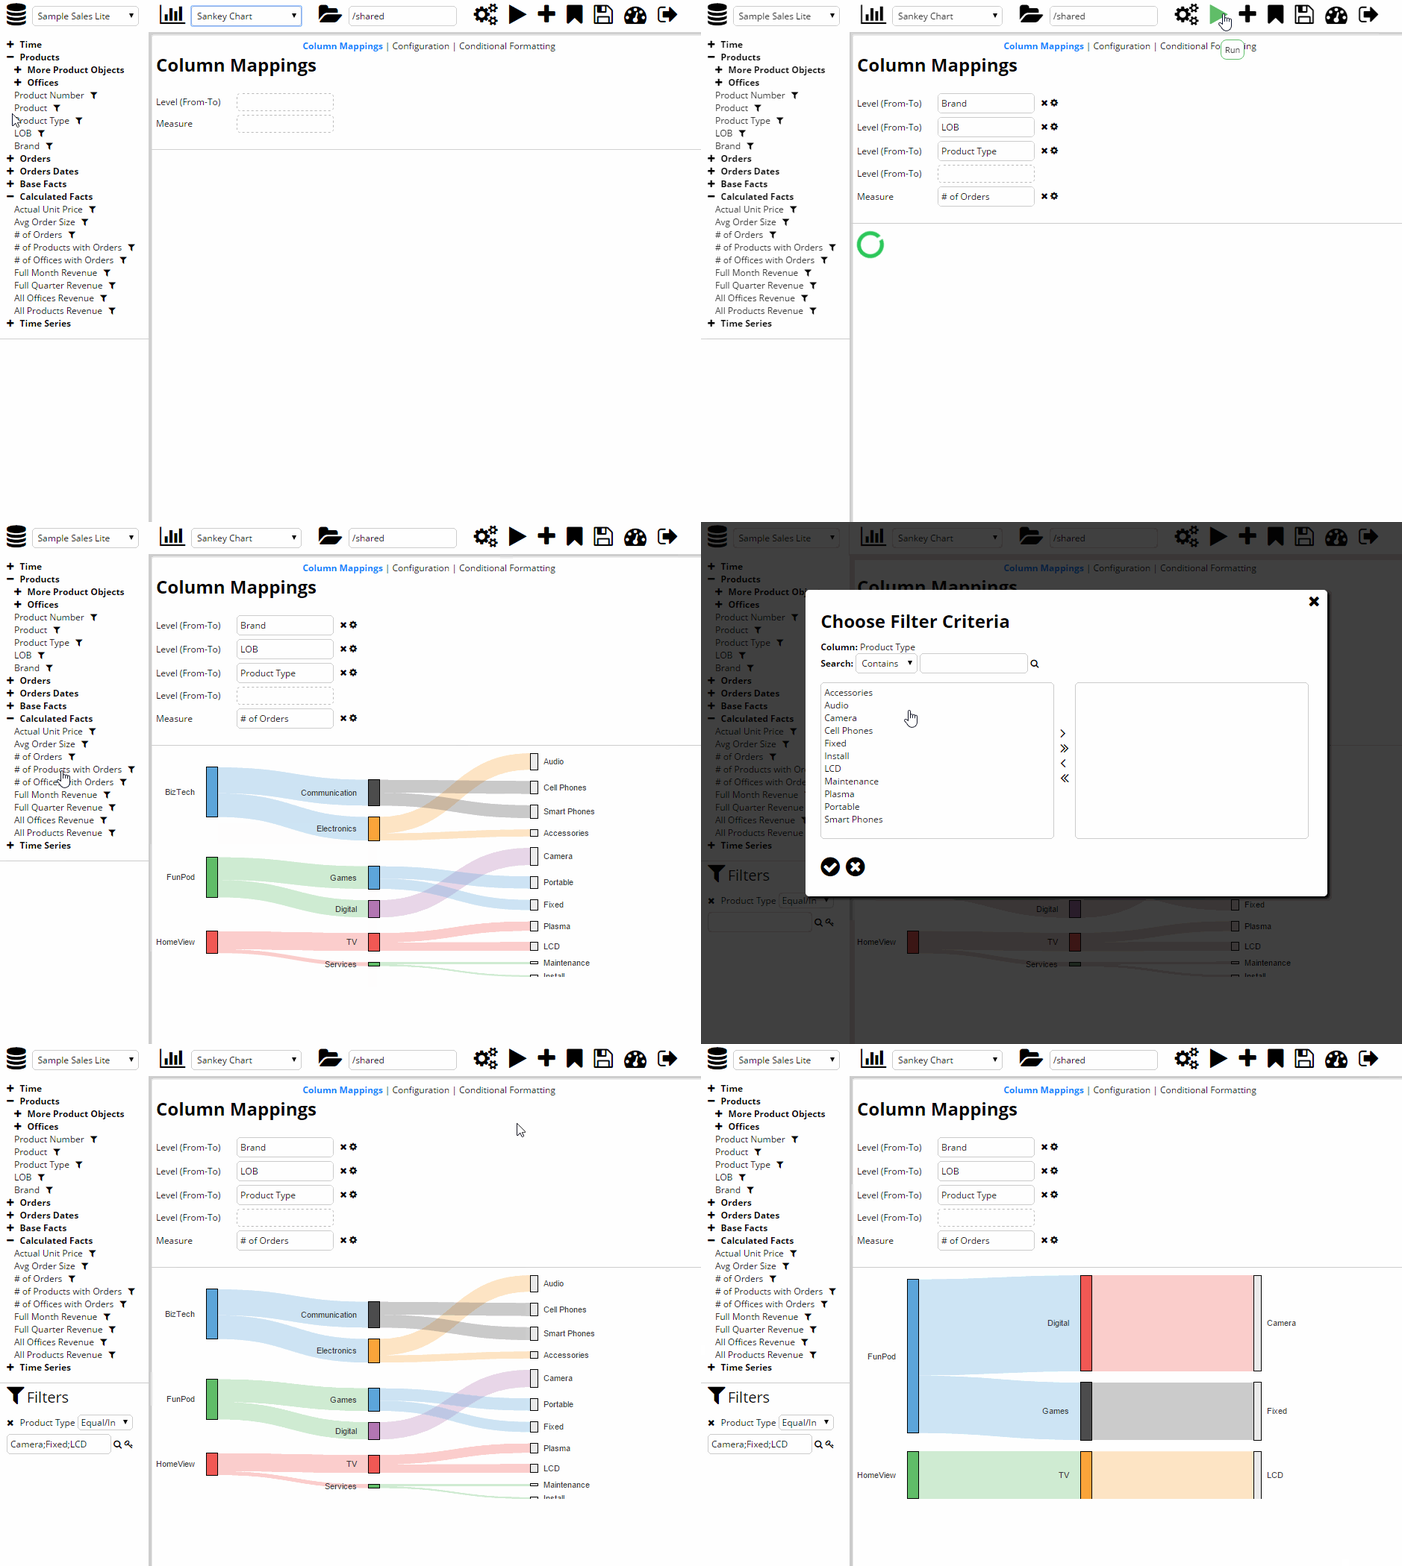
The next screen capture shows a Sankey chart and applies a filter to the query. The filter mechanism also has a sub search facility similar to vanilla OBIEE.
Conditional Formatting
The next example shows a pivot table being created and the conditional formatting functionality available.
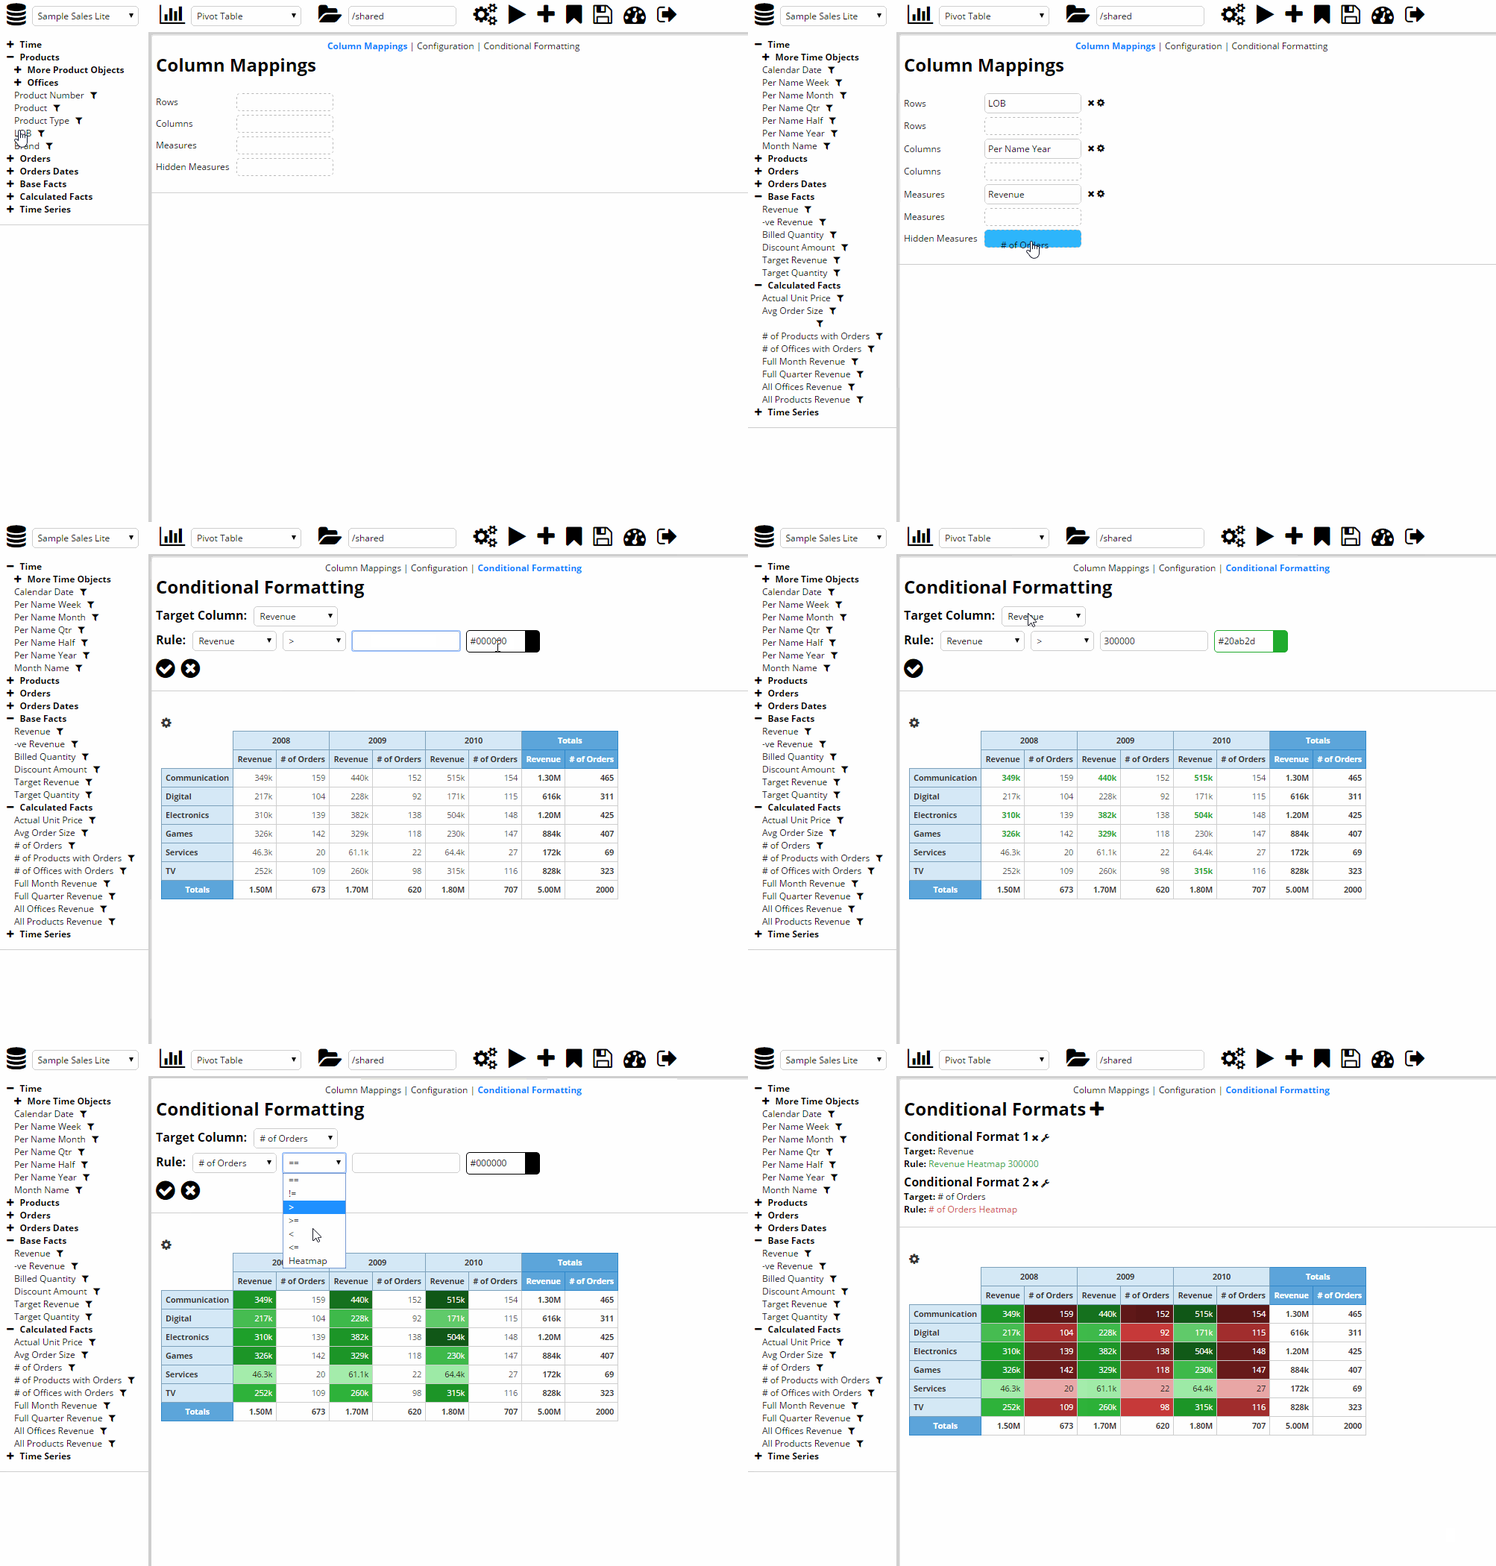
The conditional format tab allows you to choose the columns to apply formatting to as well as the formatting rule that should be applied. Additionally, a plugin developer can specify custom conditional formats to be available for specific plugins. The heatmap formatting style is one such example for the pivot table.
Adding and Editing Columns
Similar to vanilla OBIEE, columns formats and formulae can be edited and added for visualisations.
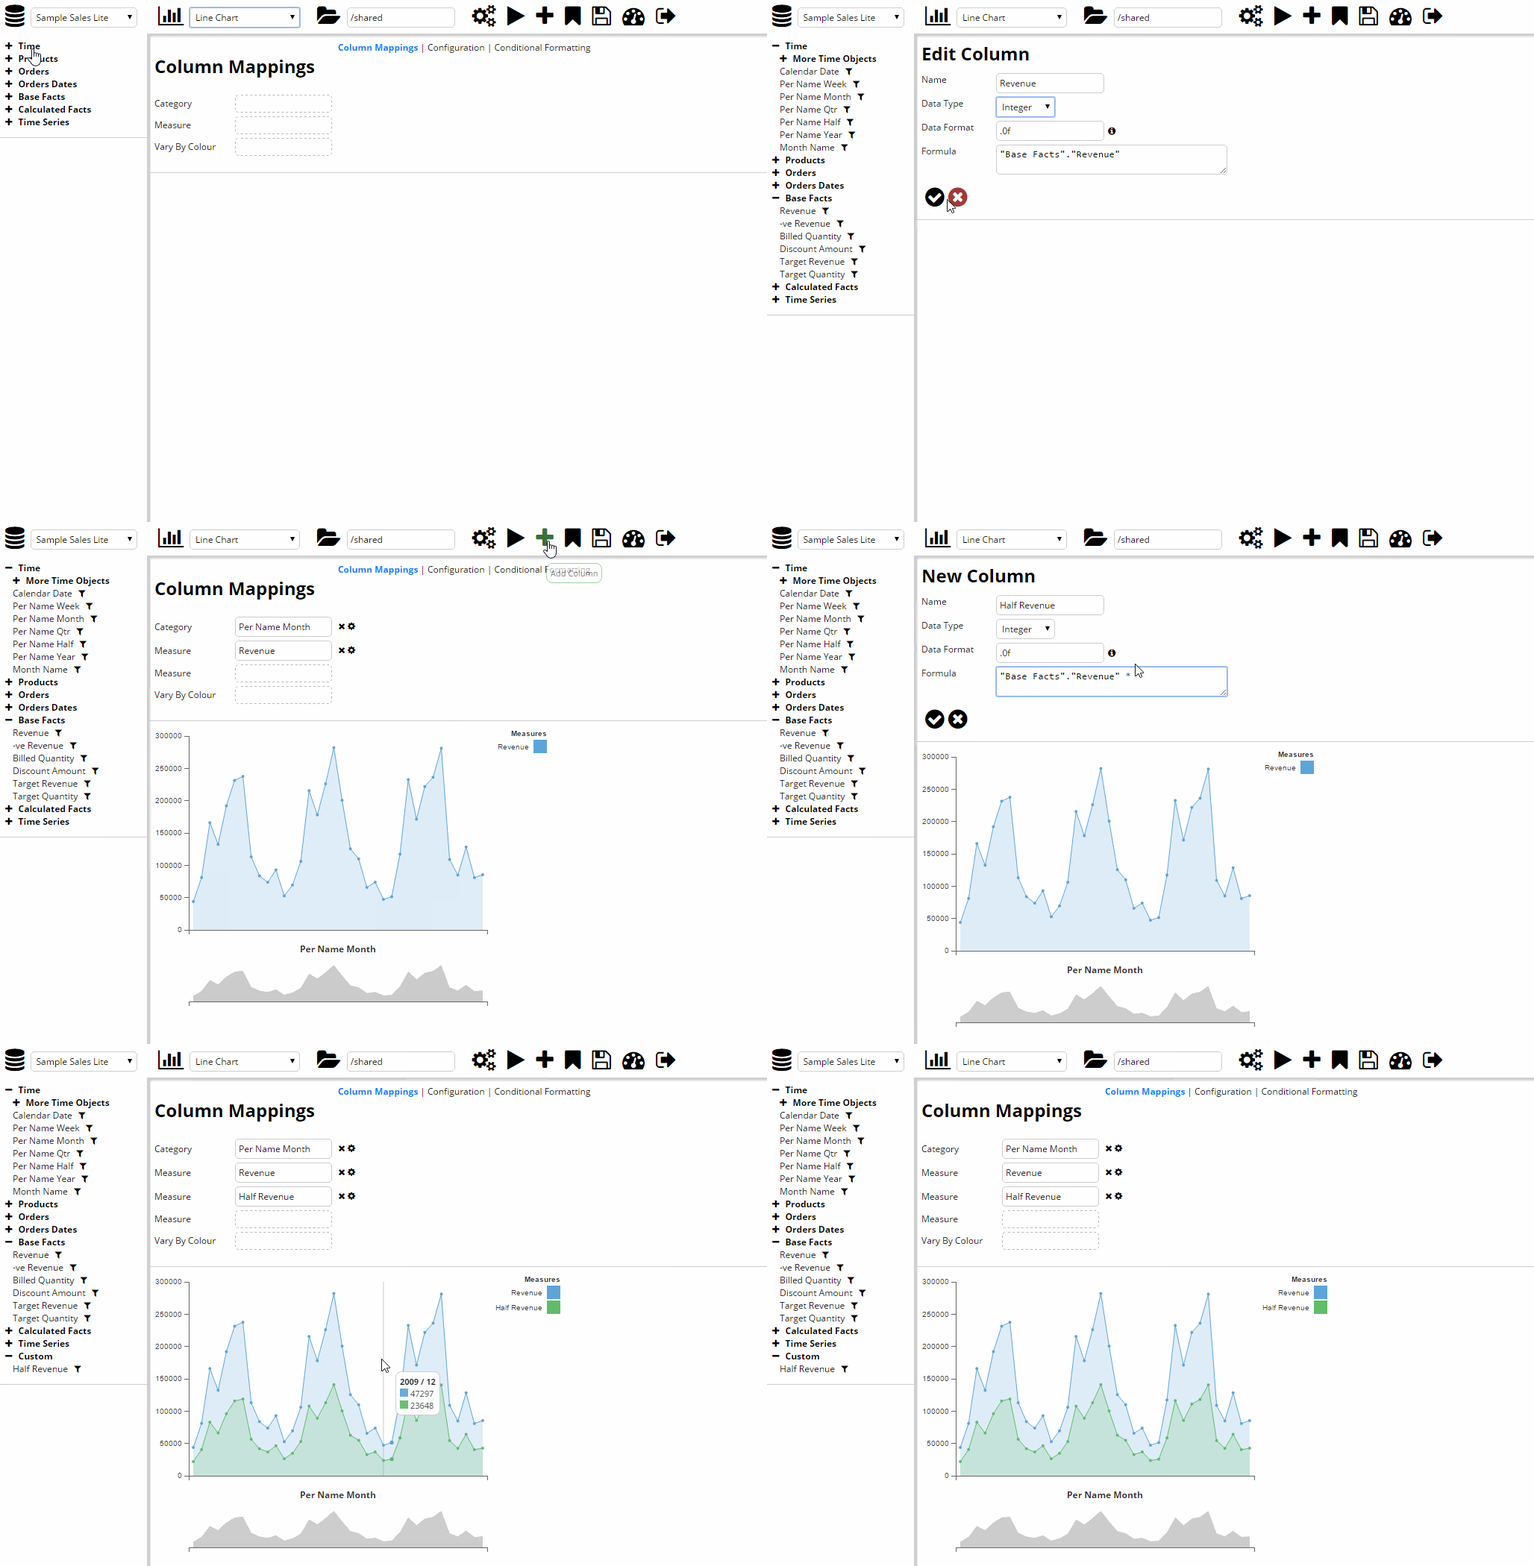
Saving/Loading
Visualisations (and dashboard pages) can be saved and loaded to and from the web catalogue. This means that security can be applied to them in the normal way.
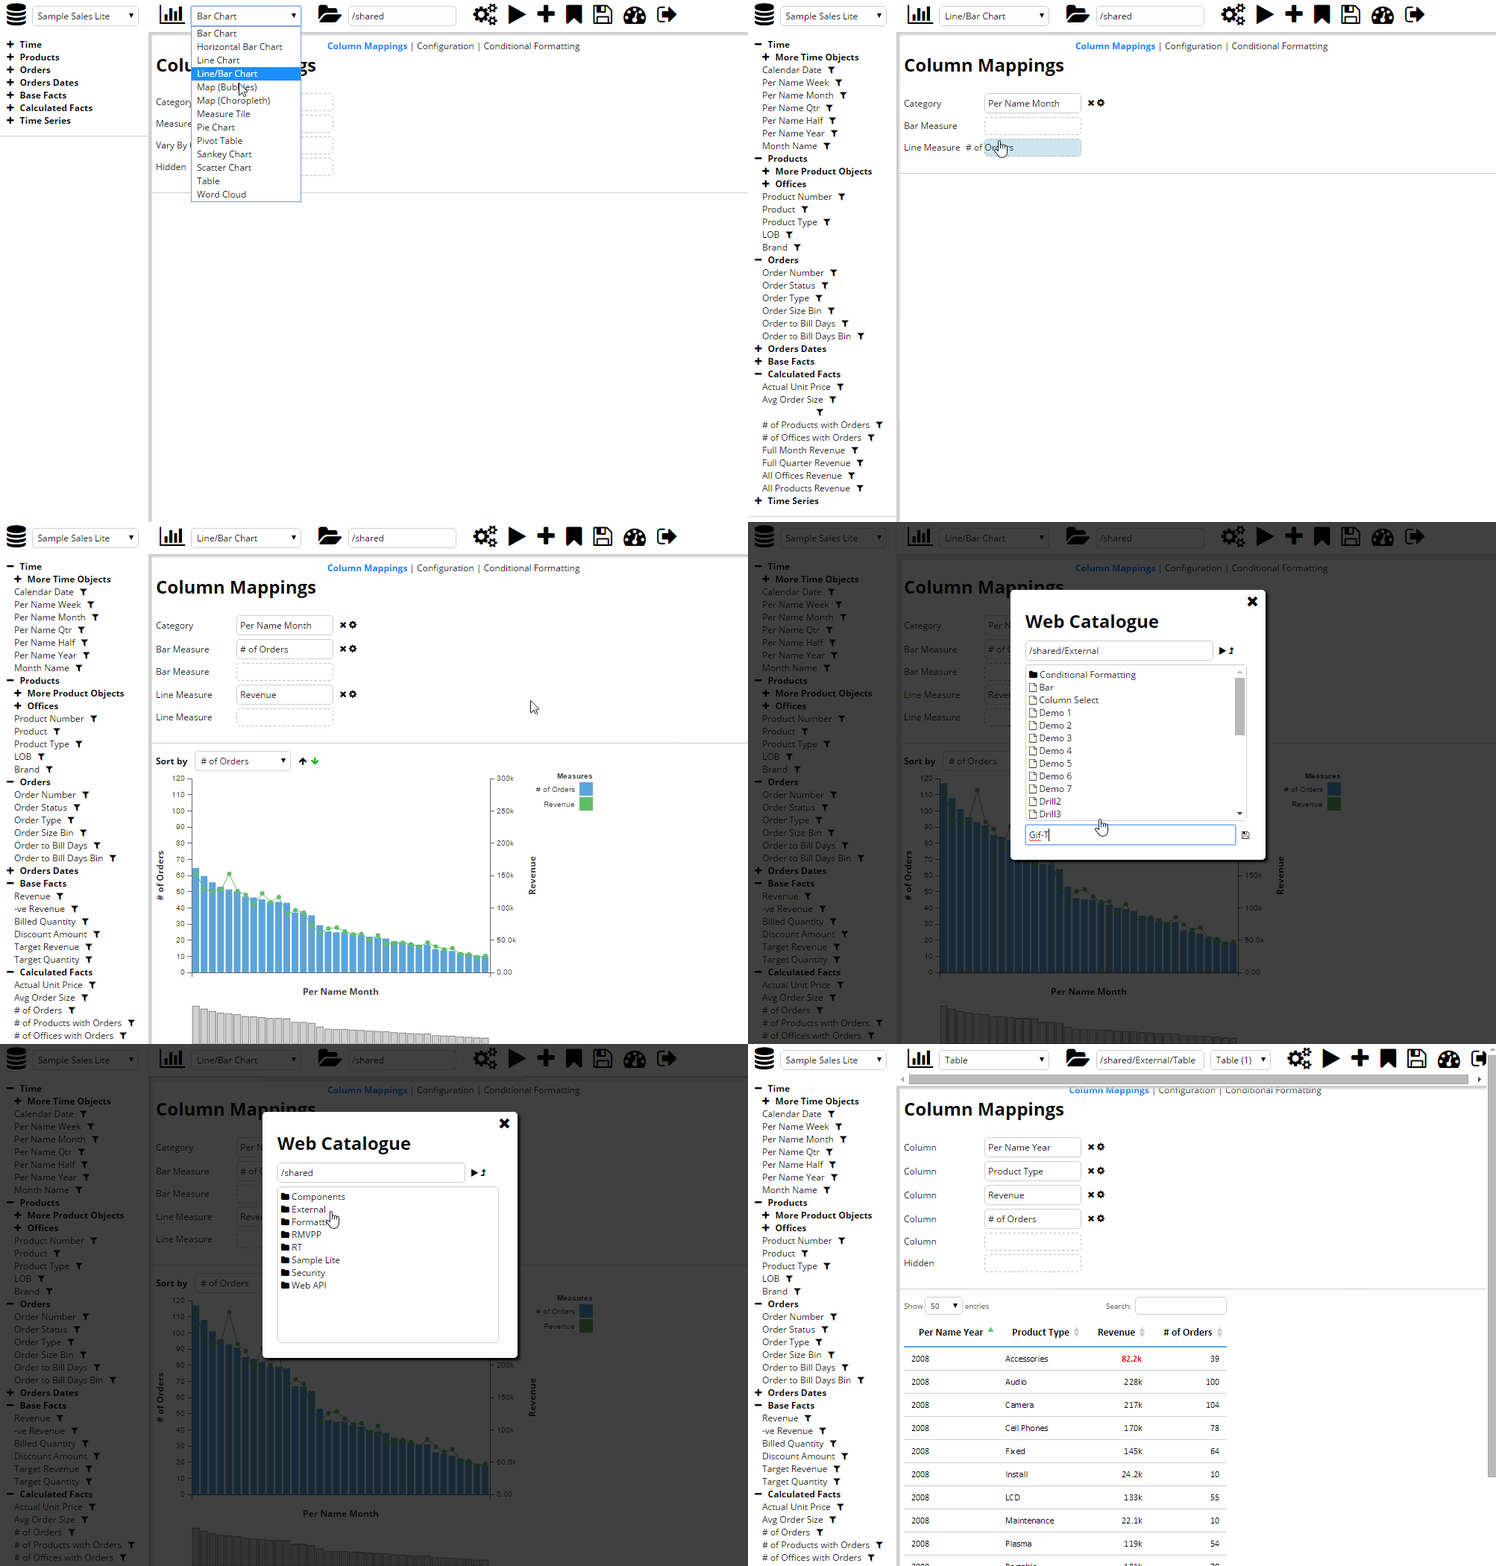
They are saved to OBIEE as analyses with Static Text views in them containing the necessary information to build the visualisation with my API. OBIEE however, will not be able to render these properly and I've stopped developing that functionality for a number of reasons I won't go into in this post. The screencapture shows a brief glimpse of the webcat explorer in my app, which is basic, but filters out any vanilla OBIEE objects, only allowing you to view and open custom objects that were created by the app.
Dashboards
The interface allows the user to create dashboards from the same app, without having to save individual visualisations first.
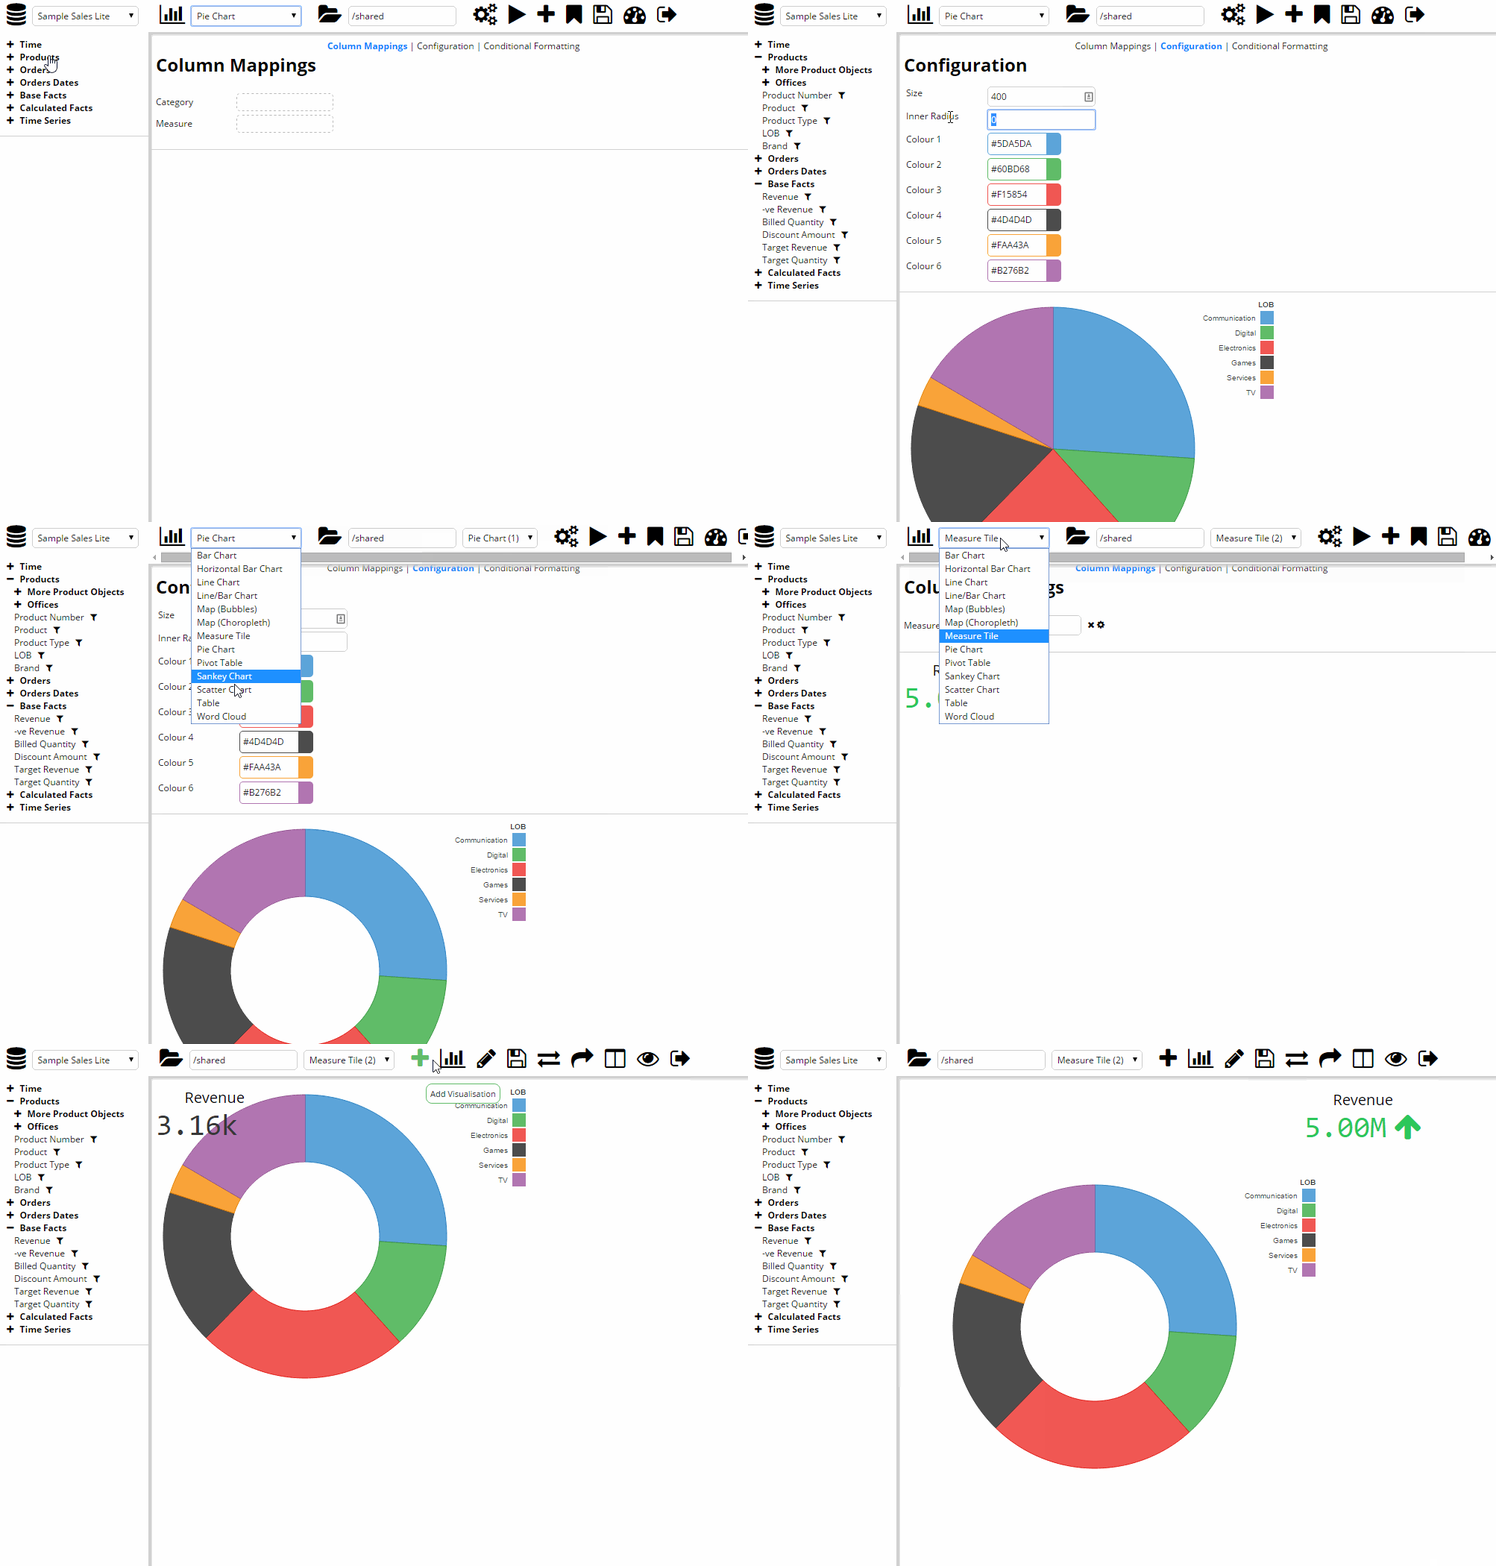
After creating and configuring a visualisation, they can be temporarily stored. Once stored, the user can switch to dashboard mode, which will have a blank canvas, allowing the user to add any stored visaulisations. The edit button in dashboard mode will allow visualisations to be freely placed on the canvas.
Interactions
The interactivity framework is probably the feature with the biggest benefit over the vanilla system that I've added.
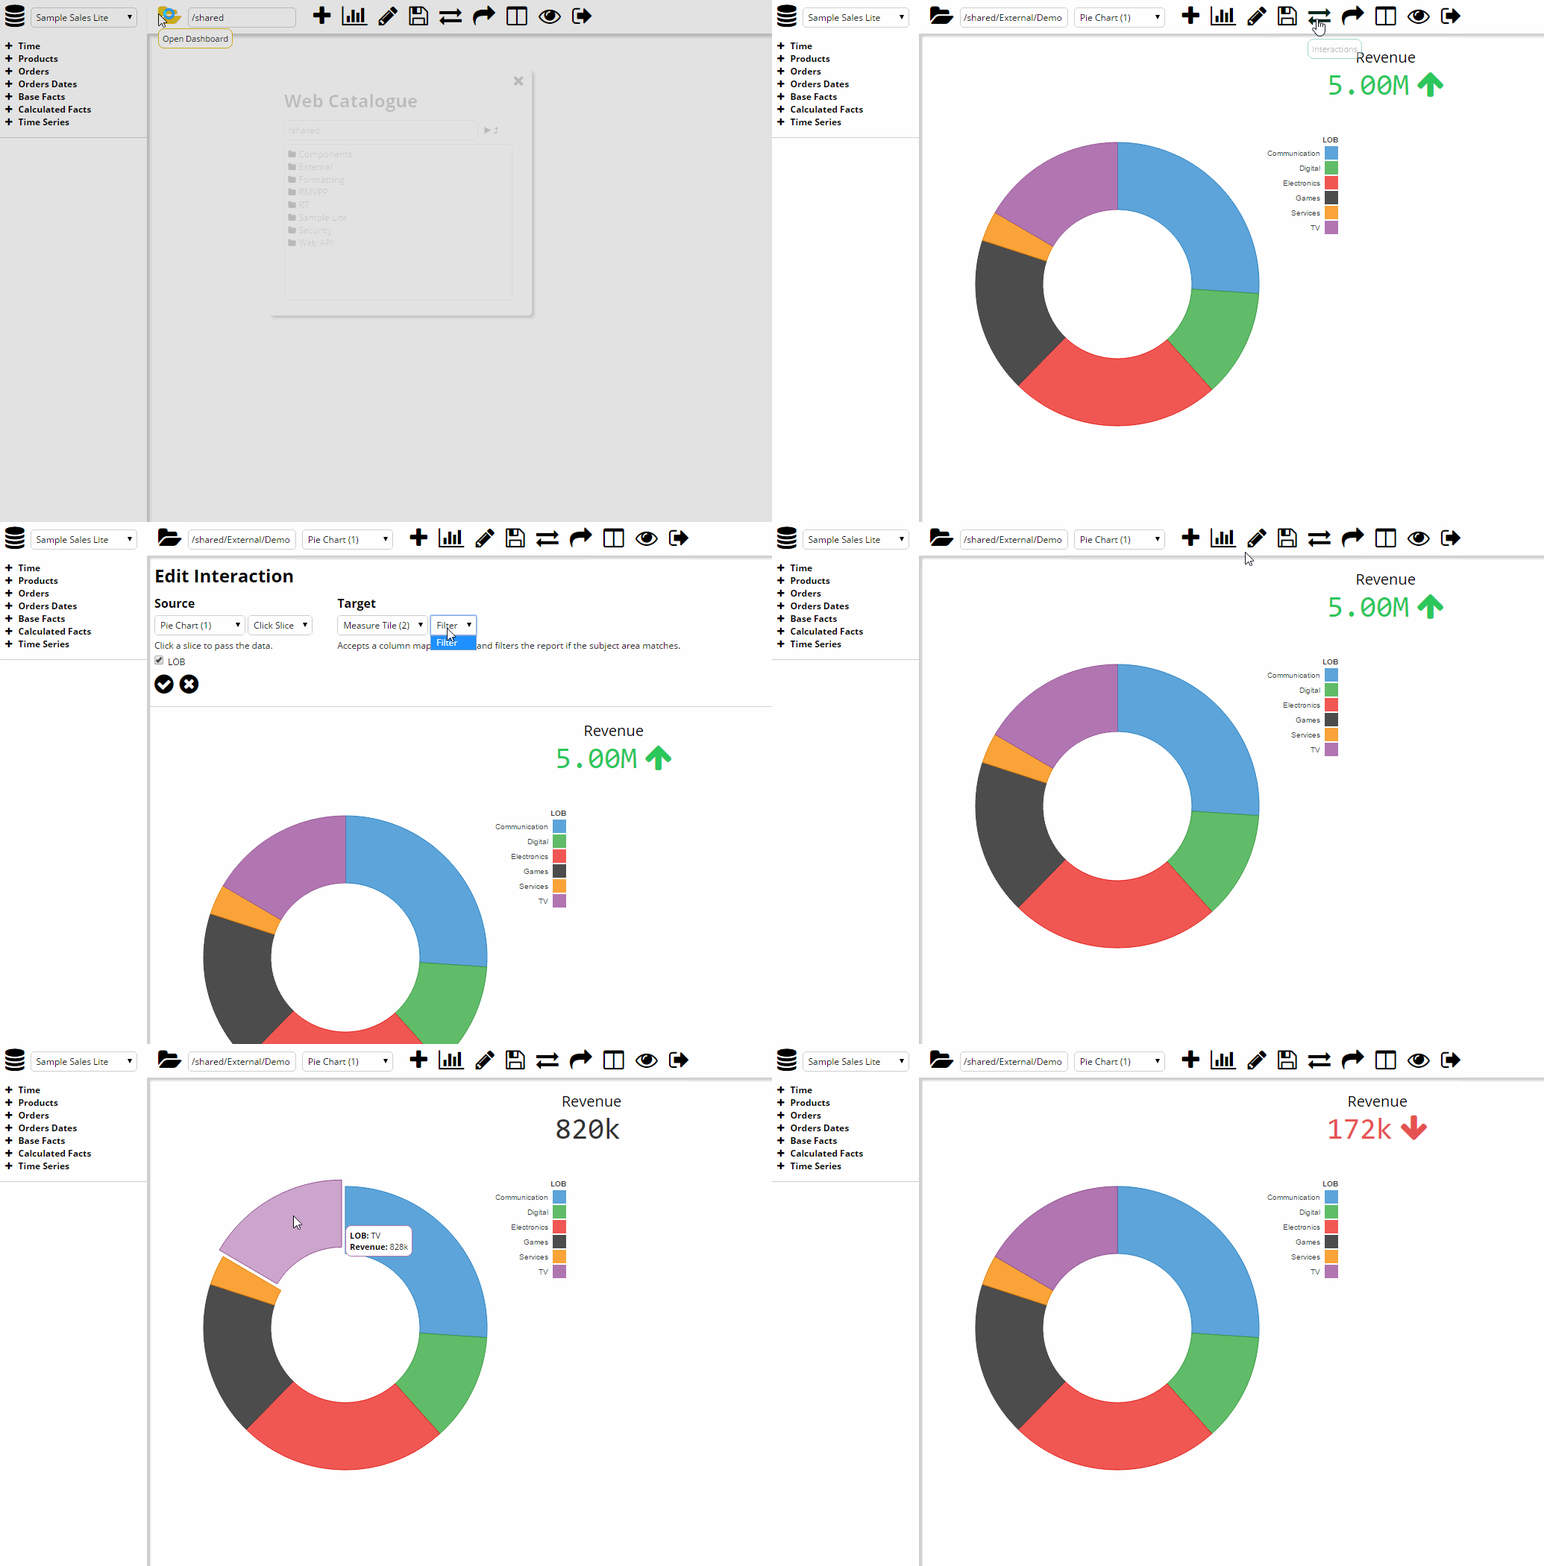
Plugin developers are able to create triggers as part of their visualisations. These triggers can be fired in most situations and tied to the data so that dynamic interactions between visualisations are possible. Users can specify what data should be passed to the target reaction. By default, every plugin can be hard filtered by an interaction, which modifies the query and goes back to the BI server. Plugin developers can also write their own reactions, allowing for interactivity only limited by the plugin designer's web development capability.
Drilldowns
Drilldowns between custom dashboard pages can be defined using the same framework as the other interactions.
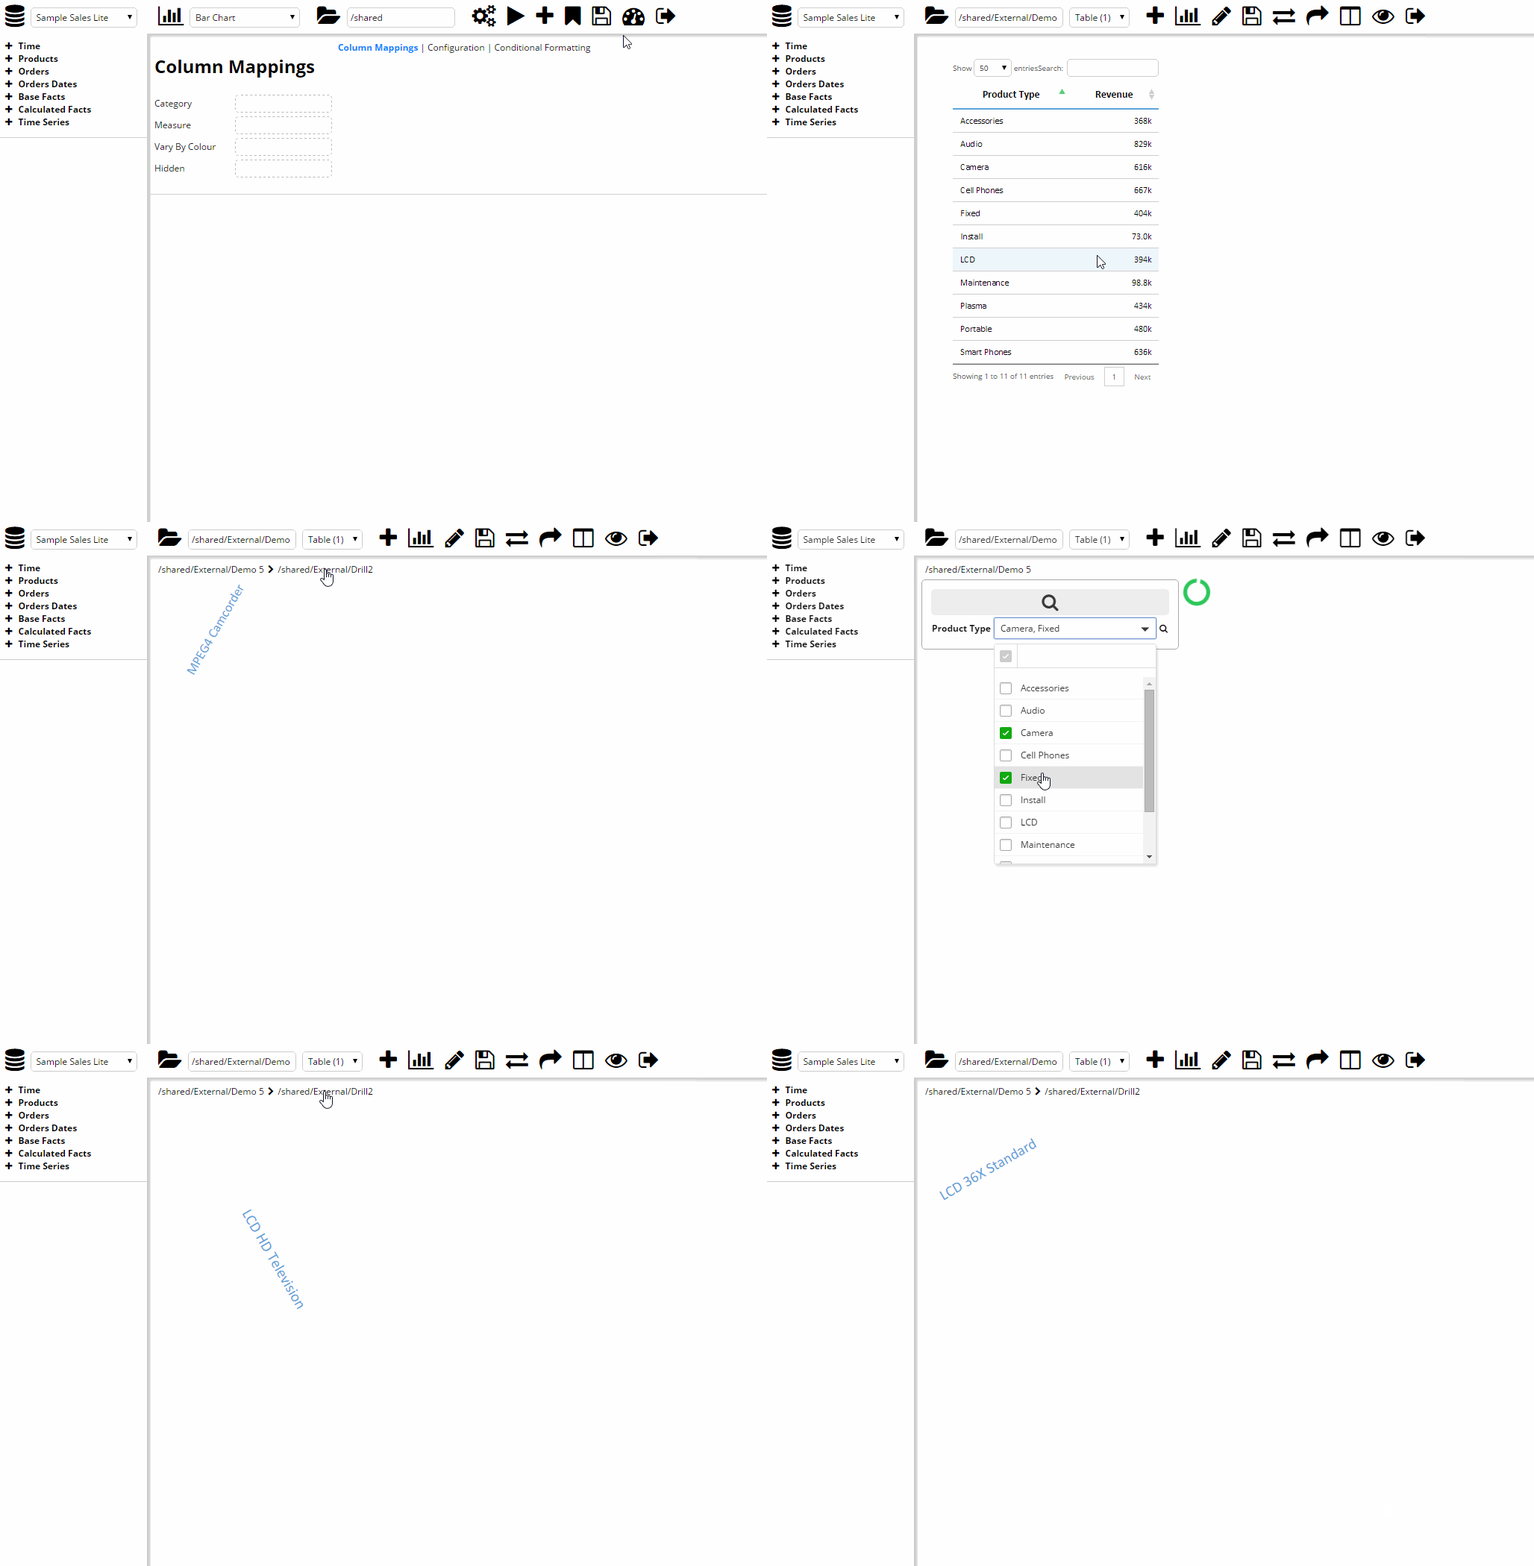
Users need only enter the webcat path for the target page in order for the drilldown to function. Each visualisation of the target dashboard will be automatically filtered (if the subject area matches) on the criteria specified by the interaction.
Dashboard Prompts
Some of the vanilla features in OBIEE are very useful, so I replicated the functionality in my app.
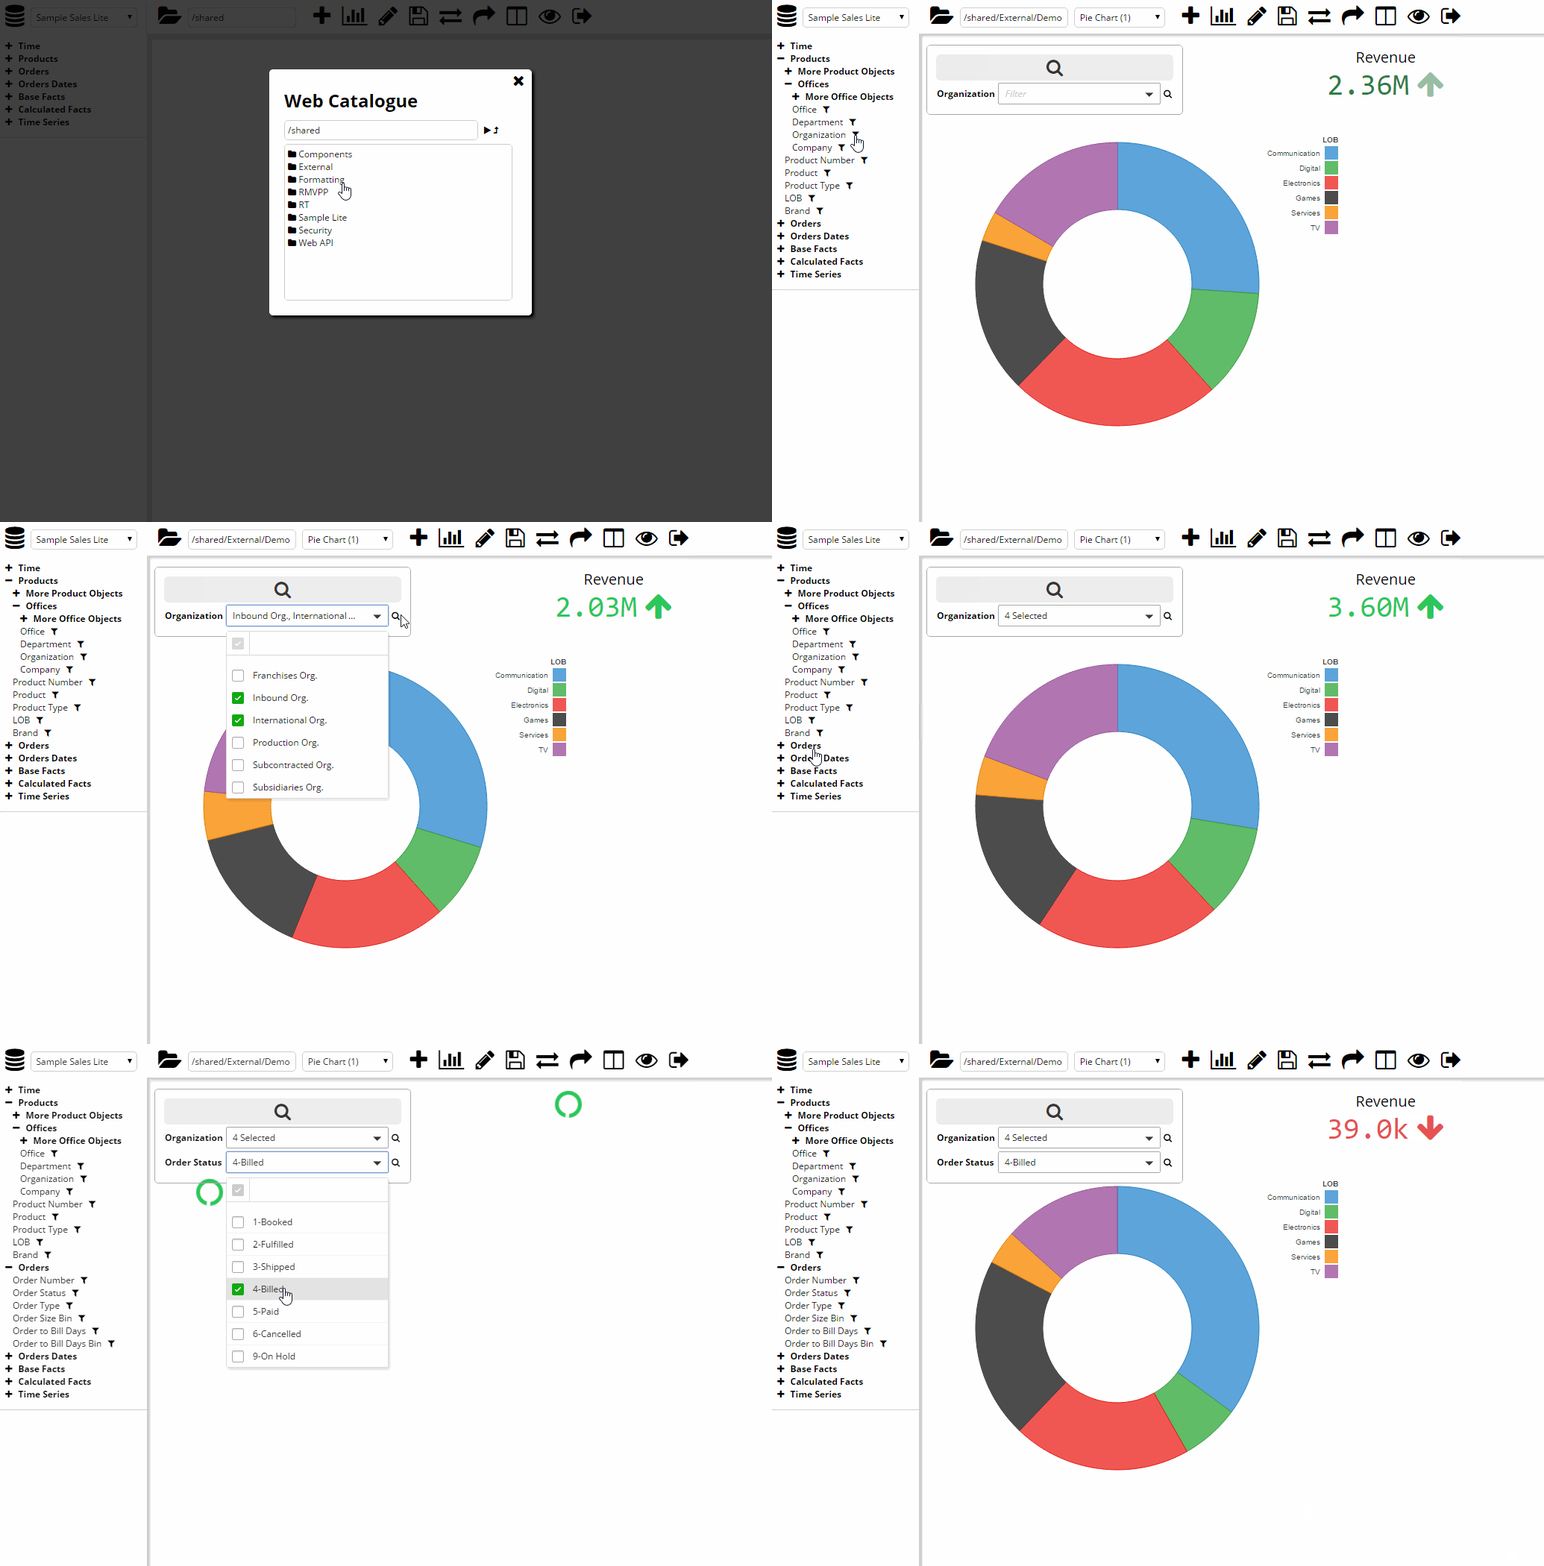
This shows the implementation of prompts to a dashboard page. Unlike OBIEE, it is not required to set an 'is prompted' filter on each target. Rather, the prompt will automatically filter any visualisations on the page that are from the same subject area.
Column Selectors
Column selectors can be added as either dropdowns or radio buttons.
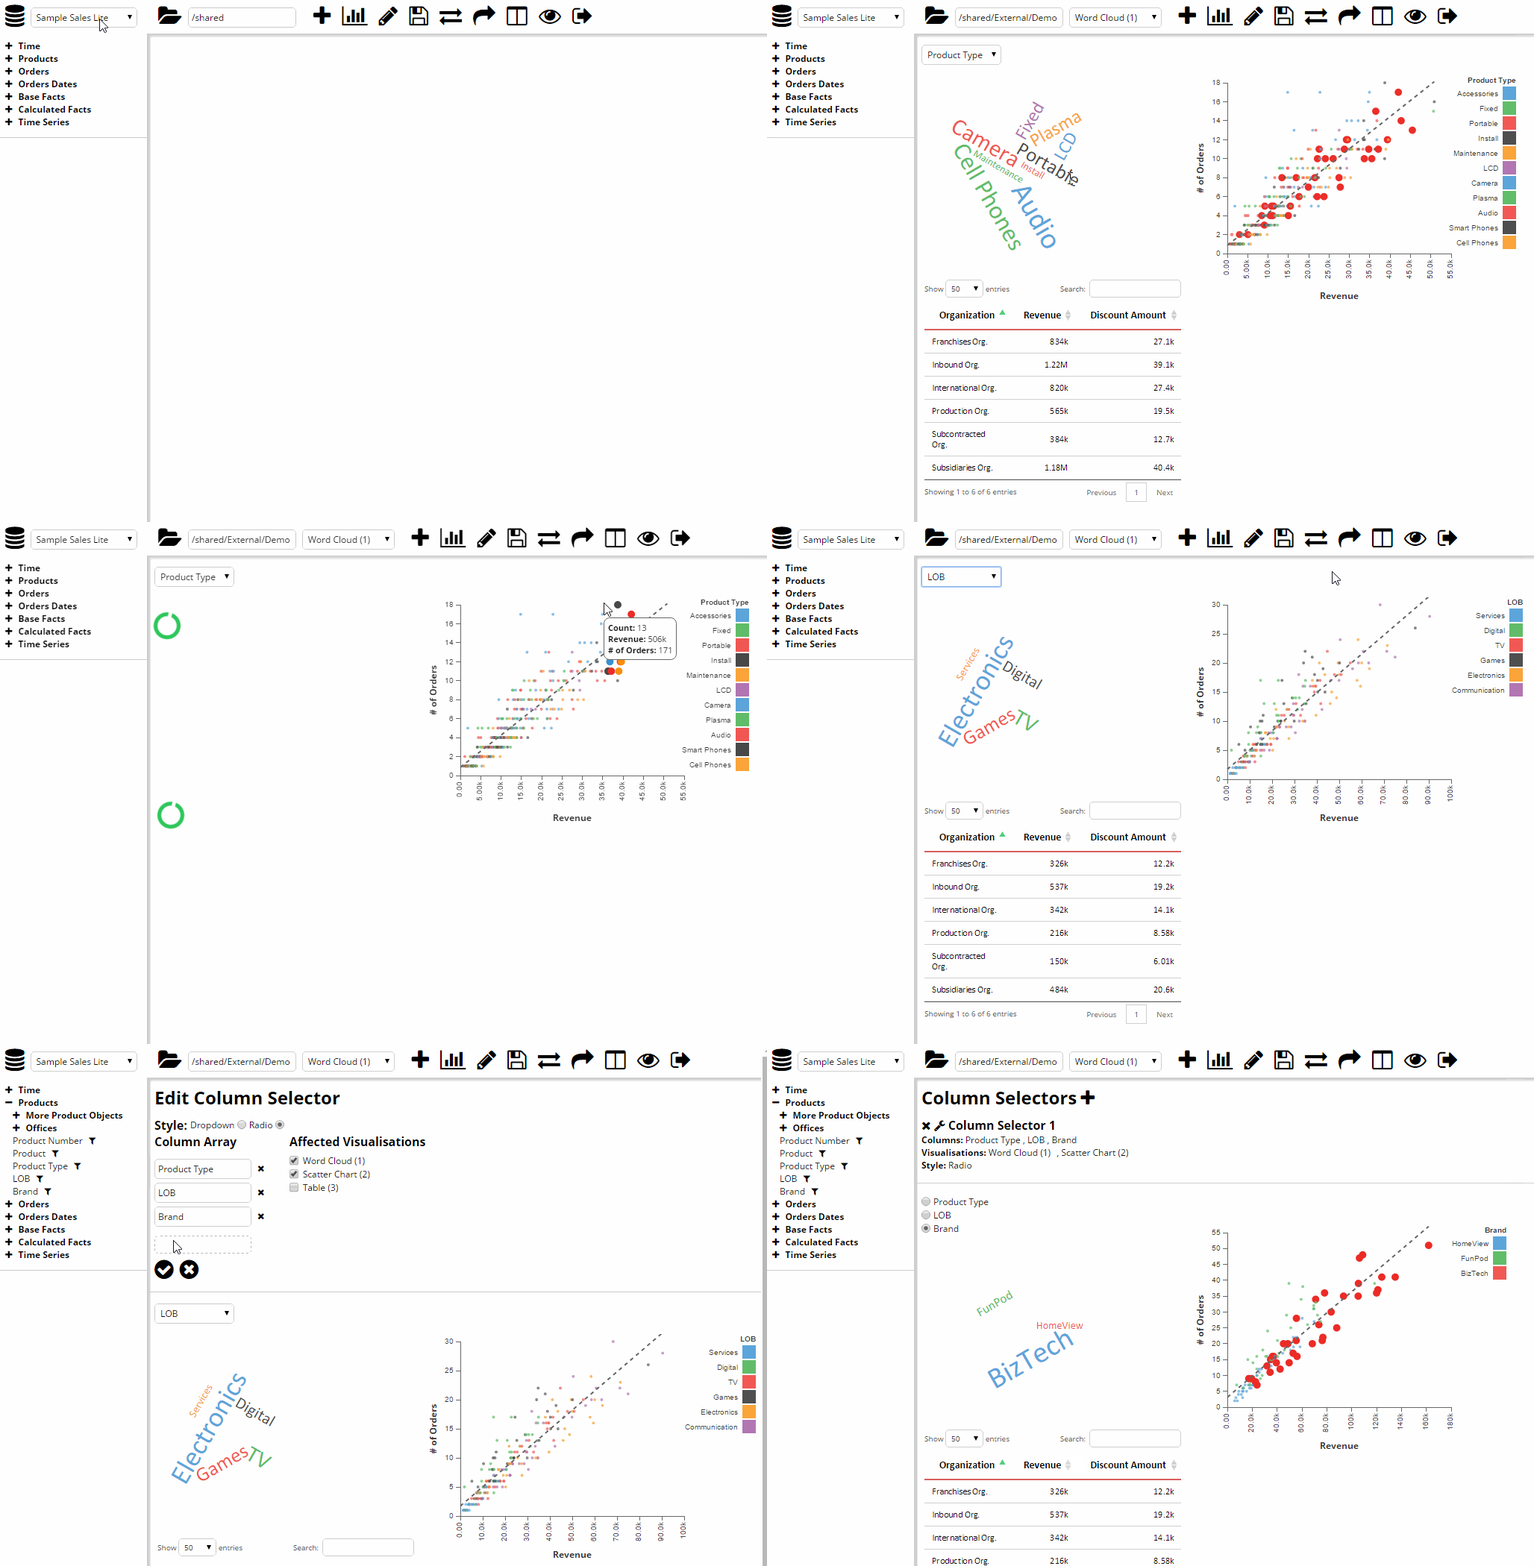
The user chooses an array of columns to be in the column selector. If any visualisations in the dashboard contain a column in this array, it will be swapped when the column selector is updated.
Map Visualisations
Two of the visualisation plugins I have made are map based, for geographical data.
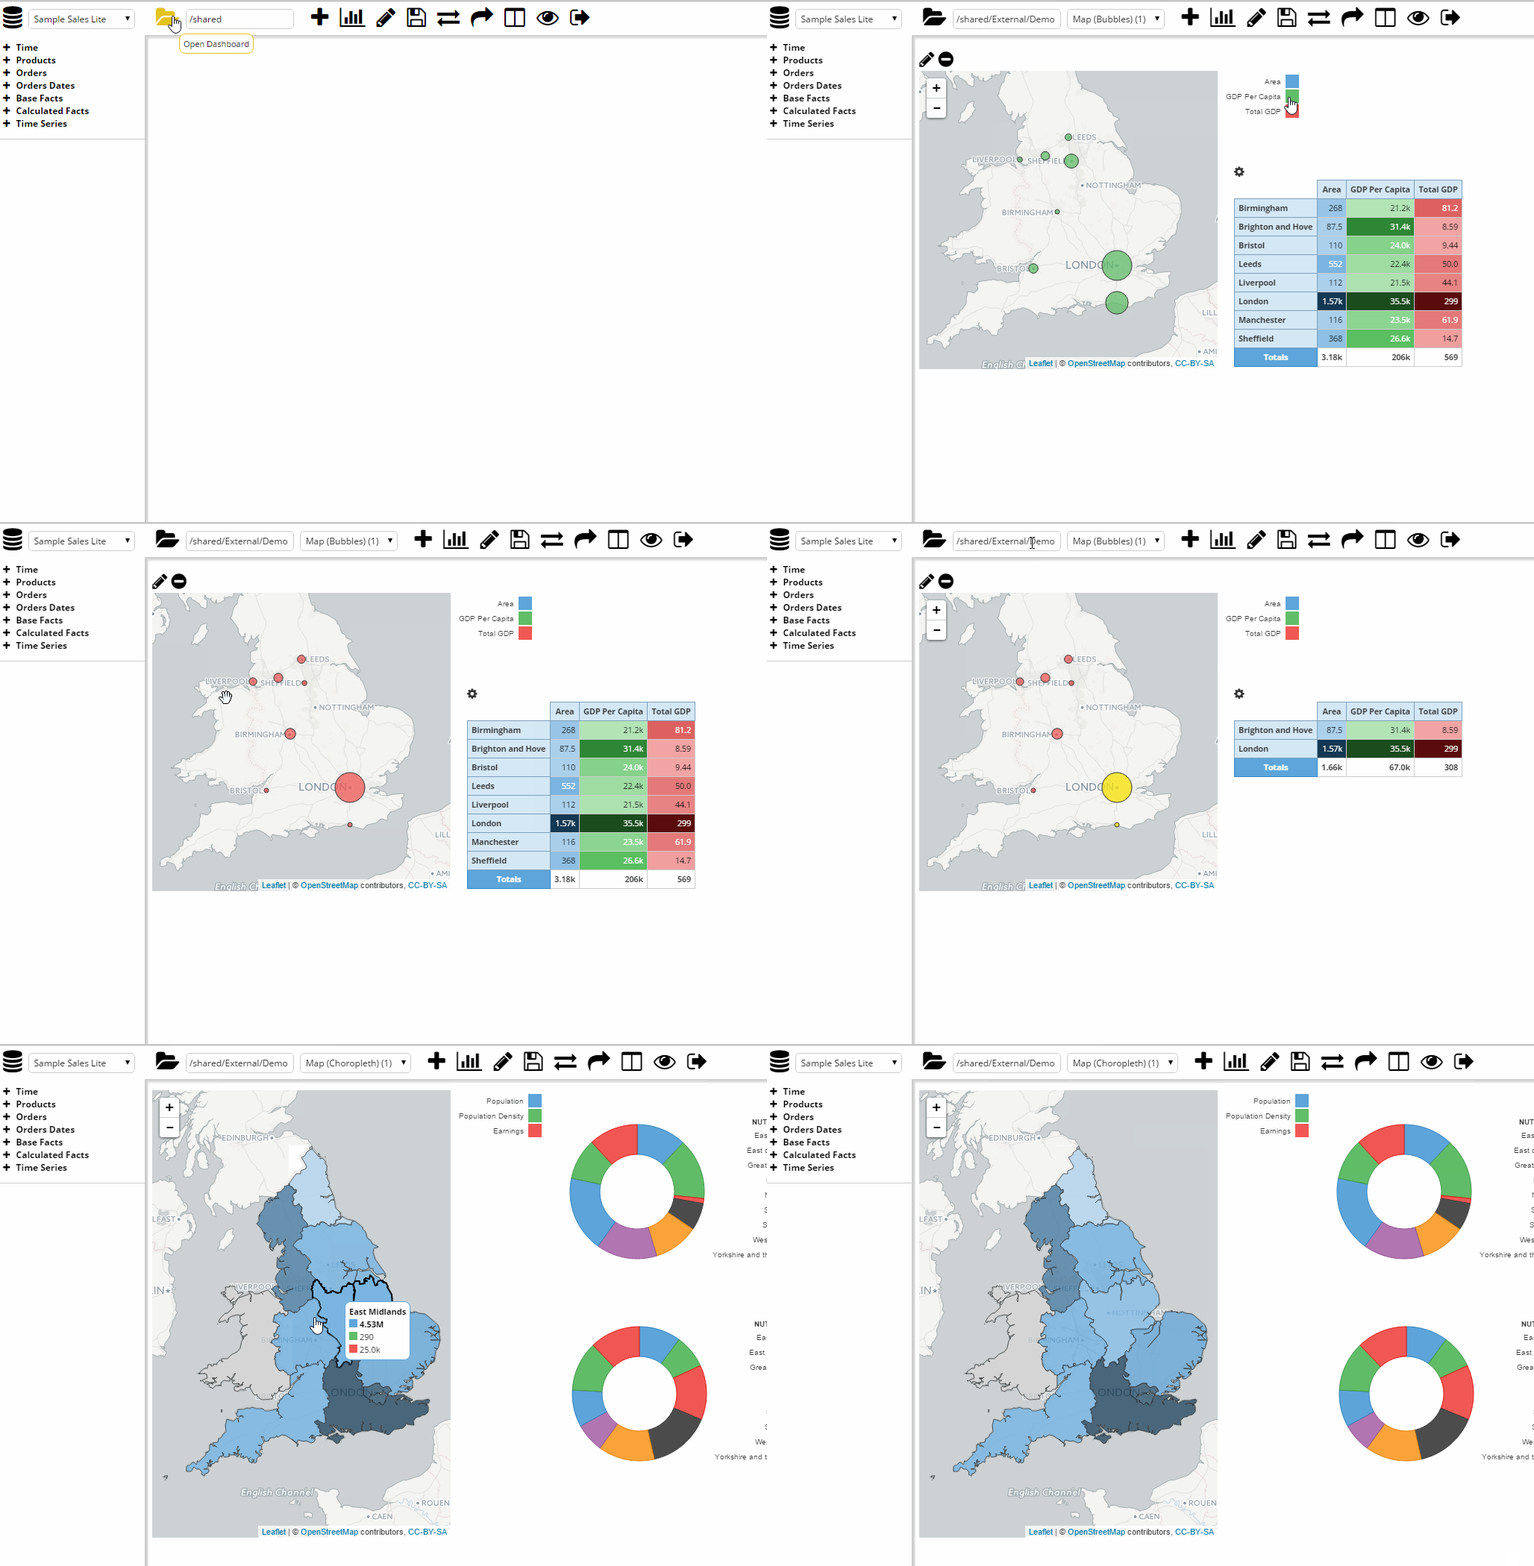
Both use LeafletJS, an open source Javascript mapping library. The first, is a bubble chart which relies on longitude and latitude being stored in the database and exposed via OBIEE. The second is a choropleth which requires a TopoJSON file of the regions in order to function. Additionally, the json file needs to have an attribute attached to each region which will act as a key to join it onto OBIEE data. So that region attribute needs to have a matching key exposed via OBIEE.
Summary
So that wraps up the major features of the app. I think it's got potential, particularly for use with MI reporting and creating highly interactive and visually appealing dashboards. Next steps will be to include a portal for navigating dashboards and the catalogue, all of which has been proved possible.
For me, the interesting thing is that this effectively provides two SDKs, one to create reproducible and configurable visualisations, one to create and modify UI behaviour.
If anyone has any comments, ideas, features or just want to know more about the app and how it works, feel free to comment.
