System Metrics Collectors

The need to monitor and control the system performances is not new. What is new is the trend of clever, lightweight, easy to setup, open source metric collectors in the market, along with timeseries databases to store these metrics, and user friendly front ends through which to display and analyse the data.
In this post I will compare Telegraf, Collectl and Topbeat as lightweight metric collectors. All of them do a great job of collecting variety of useful system and application statistic data with minimal overhead to the servers. Each has the strength of easy configuration and accessible documentation but still there are some differences around range of input and outputs; how they extract the data, what metrics they collect and where they store them.
- Telegraf is part of the Influx TICK stack, and works with a vast variety of useful input plugins such as Elasticsearch, nginx, AWS and so on. It also supports a variety of outputs, obviously InfluxDB being the primary one. (Find out more...)
- Topbeat is a new tool from Elastic, the company behind Elasticsearch, Logstash, and Kibana. The Beats platform is evolving rapidly, and includes topbeat, winlogbeat, and packetbeat. In terms of metric collection its support for detailed metrics such as disk IO is relatively limited currently. (Find out more...)
- Collectl is a long-standing favourite of systems performance analysts, providing a rich source of data. This depth of complexity comes at a bit of a cost when it comes to the documentation’s accessibility, it being aimed firmly at a systems programmer! (Find out more...)
In this post I have used InfluxDB as the backend for storing the data, and Grafana as the front end visualisation tool. I will explain more about both tools later in this post.
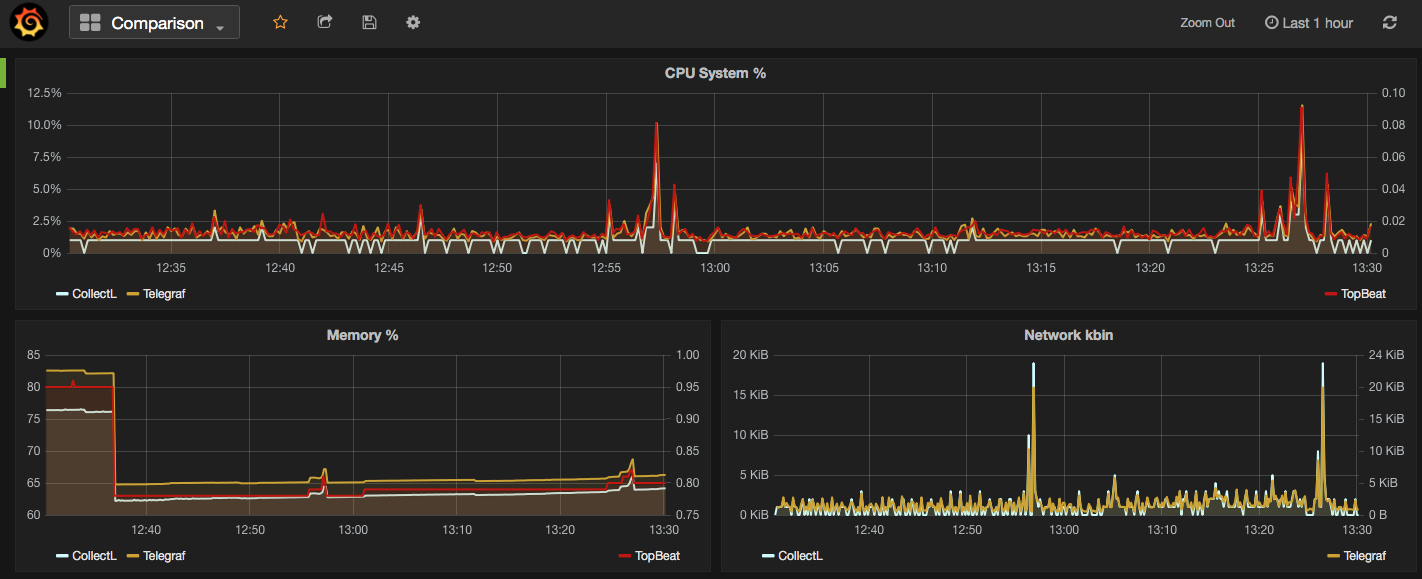
In the screenshot below I have used Grafana dashboards to show "Used CPU", "Used Memory" and "Network Traffic" stats from the mentioned collectors. As you can see the output of all three is almost the same. What makes them different is:
- What your infrastructure can support? For example, you cannot install Telegraf on old version of X Server.
- What input plugins do you need? The current version of Topbeat doesn’t support more detailed metrics such as disk IO and network stats.
- What storage do you want/need to use for the outputs? InfluxDB works as the best match for Telegraf data, whilst Beats pairs naturally with Elasticsearch
- What is your visualisation tool and what does it work with best. In all cases the best front end should natively support time series visualisations.

Next I am going to provide more details on how to download/install each of the mentioned metrics collector services, example commands are written for a linux system.
Telegraf
"An open source agent written in Go for collecting metrics and data on the system it's running on or from other services. Telegraf writes data it collects to InfluxDB in the correct format."
- Download and install InfluxDB:
sudo yum install -y https://s3.amazonaws.com/influxdb/influxdb-0.10.0-1.x86_64.rpm - Start the InfluxDB service:
sudo service influxdb start - Download Telegraf:
wget http://get.influxdb.org/telegraf/telegraf-0.12.0-1.x86_64.rpm - Install Telegraf:
sudo yum localinstall telegraf-0.12.0-1.x86_64.rpm - Start the Telegraf service:
sudo service telegraph start - Done!
The default configuration file for Telegraf sits in /etc/telegraf/telegraf.conf or a new config file can be generated using the -sample-config flag on the location of your choice: telegraf -sample-config > telegraf.conf . Update the config file to enable/disable/setup different input or outputs plugins e.g. I enabled network inputs: [[inputs.net]]. Finally to test the config files and to verify the output metrics run: telegraf -config telegraf.conf -test
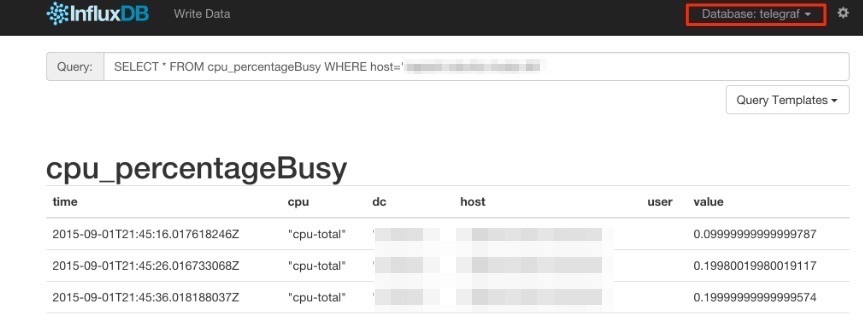
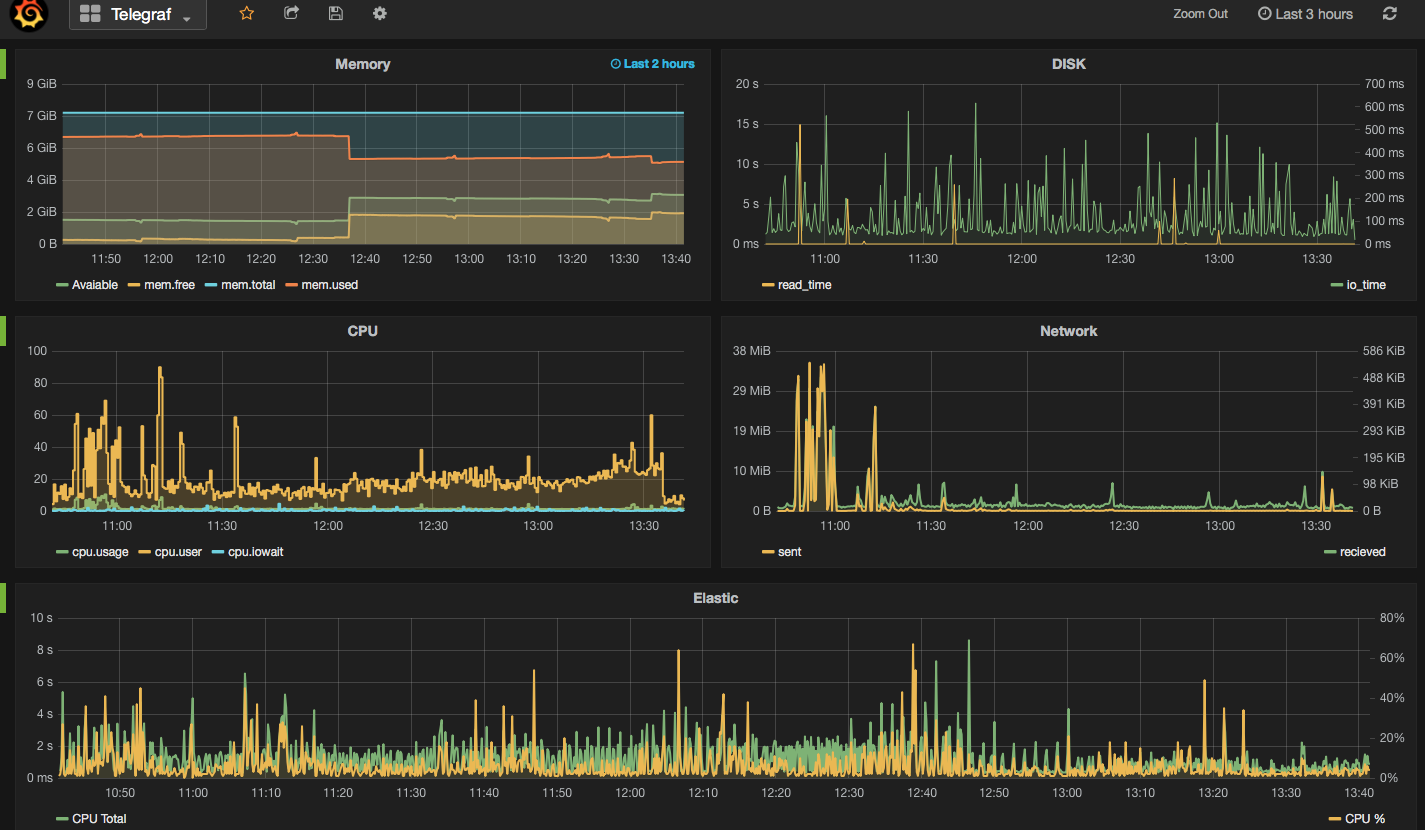
Once all ready and started, a new database called 'telegraf' will be added to the InfluxDB storage which you can connect and query. You will read more about InfluxDB in this post.
Collectl
Unlike most monitoring tools that either focus on a small set of statistics, format their output in only one way, run either interactively or as a daemon but not both, collectl tries to do it all. You can choose to monitor any of a broad set of subsystems which currently include buddyinfo, cpu, disk, inodes, infiniband, lustre, memory, network, nfs, processes, quadrics, slabs, sockets and tcp.
- Install collectl:
sudo yum install collectl - Update the Collectl config file at
/etc/collectl.confto turn on/off different switches and also to write the Collectl's output logs to a database, i.e. InfluxDB - Restart Collectl service
sudo service collectl restart - Collectl will write its log in a new InfluxDB database called “graphite”.
Topbeat
Topbeat is a lightweight way to gather CPU, memory, and other per-process and system wide data, then ship it to (by default) Elasticsearch to analyze the results.
- Download Topbeat:
wget https://download.elastic.co/beats/topbeat/topbeat-1.2.1-x86_64.rpm - Install:
sudo yum local install topbeat-1.2.1-x86_64.rpm - Edit the topbeat.yml configuration file at
/etc/topbeatand set the output to elasticsearch or logstash. - If choosing elasticsearch as output, you need to load the index template, which lets Elasticsearch know which fields should be analyzed in which way. The recommended template file is installed by the Topbeat packages. You can either configure Topbeat to load the template automatically, Or you can run a shell script to load the template:
curl -XPUT 'http://localhost:9200/_template/topbeat -d@/etc/topbeat/topbeat.template.json - Run topbeat:
sudo /etc/init.d/topbeat start - To test your Topbeat Installation try:
curl -XGET 'http://localhost:9200/topbeat-*/_search?pretty' - TopBeat logs are written at
/var/log - Reference to output fields
Why write another metrics collector?
From everything that I have covered above, it is obvious that there is no shortage of open source agents for collecting metrics. Still you may come across a situation that none of the options could be used e.g. specific operating system (in this case, MacOS on XServe) that can’t support any of the options above. The below code is my version of light metric collector, to keep track of Disk IO stats, network, CPU and memory of the host where the simple bash script will be run.
The code will run through an indefinite loop until it is forced quit. Within the loop, first I have used a CURL request (InfluxDB API Reference) to create a database called OSStat, if the database name exists nothing will happen. Then I have used a variety of built-in OS tools to extract the data I needed. In my example sar -u for cpu, sar -n for network, vm_stat for memory, iotop for diskio could return the values I needed. With a quick search you will find many more options. I also used a combinations of awk, sed and grep to transform the values from these tools to the structure that I was easier to use on the front end. Finally I pushed the results to InfluxDB using the curl requests.
#!/bin/bash
export INFLUX_SERVER=$1
while [ 1 -eq 1 ];
do

#######CREATE DATABASE ########
curl -G http://$INFLUX_SERVER:8086/query  -s --data-urlencode "q=CREATE DATABASE OSStat" > /dev/null

####### CPU  #########
sar 1 1 -u | tail -n 1 | awk -v MYHOST=$(hostname)   '{  print "cpu,host="MYHOST"  %usr="$2",%nice="$3",%sys="$4",%idle="$5}' | curl -i -XPOST "http://${INFLUX_SERVER}:8086/write?db=OSStat"  -s --data-binary @- > /dev/null

####### Memory ##########
FREE_BLOCKS=$(vm_stat | grep free | awk '{ print $3 }' | sed 's/\.//')
INACTIVE_BLOCKS=$(vm_stat | grep inactive | awk '{ print $3 }' | sed 's/\.//')
SPECULATIVE_BLOCKS=$(vm_stat | grep speculative | awk '{ print $3 }' | sed 's/\.//')
WIRED_BLOCKS=$(vm_stat | grep wired | awk '{ print $4 }' | sed 's/\.//')

FREE=$((($FREE_BLOCKS+SPECULATIVE_BLOCKS)*4096/1048576))
INACTIVE=$(($INACTIVE_BLOCKS*4096/1048576))
TOTALFREE=$((($FREE+$INACTIVE)))
WIRED=$(($WIRED_BLOCKS*4096/1048576))
ACTIVE=$(((4096-($TOTALFREE+$WIRED))))
TOTAL=$((($INACTIVE+$WIRED+$ACTIVE)))

curl -i -XPOST "http://${INFLUX_SERVER}:8086/write?db=OSStat"  -s --data-binary  "memory,host="$(hostname)" Free="$FREE",Inactive="$INACTIVE",Total-free="$TOTALFREE",Wired="$WIRED",Active="$ACTIVE",total-used="$TOTAL > /dev/null

####### Disk IO ##########
iotop -t 1 1 -P | head -n 2  | grep 201 | awk -v MYHOST=$(hostname)
  '{ print "diskio,host="MYHOST" io_time="$6"read_bytes="$8*1024",write_bytes="$11*1024}'  | curl -i -XPOST "http://${INFLUX_SERVER}:8086/write?db=OSStat"  -s --data-binary @- > /dev/null

###### NETWORK ##########
sar -n DEV 1  |grep -v IFACE|grep -v Average|grep -v -E ^$ | awk -v MYHOST="$(hostname)" '{print "net,host="MYHOST",iface="$2" pktin_s="$3",bytesin_s="$4",pktout_s="$4",bytesout_s="$5}'|curl -i -XPOST "http://${INFLUX_SERVER}:8086/write?db=OSStat"  -s --data-binary @- > /dev/null

sleep 10;
done
InfluxDB Storage
"InfluxDB is a time series database built from the ground up to handle high write and query loads. It is the second piece of the TICK stack. InfluxDB is meant to be used as a backing store for any use case involving large amounts of timestamped data, including DevOps monitoring, application metrics, IoT sensor data, and real-time analytics."
InfluxDB's SQL-like query language is called InfluxQL, You can connect/query InfluxDB via Curl requests (mentioned above), command line or browser. The following sample InfluxQLs cover useful basic command line statements to get you started:
influx -- Connect to the database

SHOW DATABASES  -- Show existing databases, _internal is the embedded databased used for internal metrics

USE telegraf -- Make 'telegraf' the current database

SHOW MEASUREMENTS -- show all tables within current database

SHOW FIELD KEYS -- show tables definition within current database
InfluxDB also have a browser admin console that is by default accessible on port 8086. (Official Reference) (Read more on RittmanMead Blog)

Grafana Visualisation
"Grafana provides rich visualisation options best for working with time series data for Internet infrastructure and application performance analytics."
Best to use InfluxDB as datasource for Grafana as Elasticsearch datasources doesn't support all Grafana's features e.g. functions behind the panels. Here is a good introduction video to visualisation with Grafana.
- Straight forward Installation:
sudo yum install -y https://grafanarel.s3.amazonaws.com/builds/grafana-2.6.0-1.x86_64.rpm - Start the service:
sudo service grafana-server start - Grafana is now ready to go on http://localhost:3000 (default username/password: admin/admin)

