Streaming data from Oracle using Oracle GoldenGate and Kafka Connect
This article was also posted on the Confluent blog, head over there for more great Kafka-related content!
Kafka Connect is part of the Confluent Platform, providing a set of connectors and a standard interface with which to ingest data to Kafka, and store or process it the other end. Initially launched with a JDBC source and HDFS sink, the list of connectors has grown to include a dozen certified connectors, and twice as many again 'community' connectors. These cover technologies such as MongoDB, InfluxDB, Kudu, MySQL - and of course as with any streaming technology, twitter, the de-facto source for any streaming how-to. Two connectors of note that were recently released are for Oracle GoldenGate as a source, and Elasticsearch as a sink. In this article I'm going to walk through how to set these up, and demonstrate how the flexibility and power of the Kafka Connect platform can enable rapid changes and evolutions to the data pipeline.
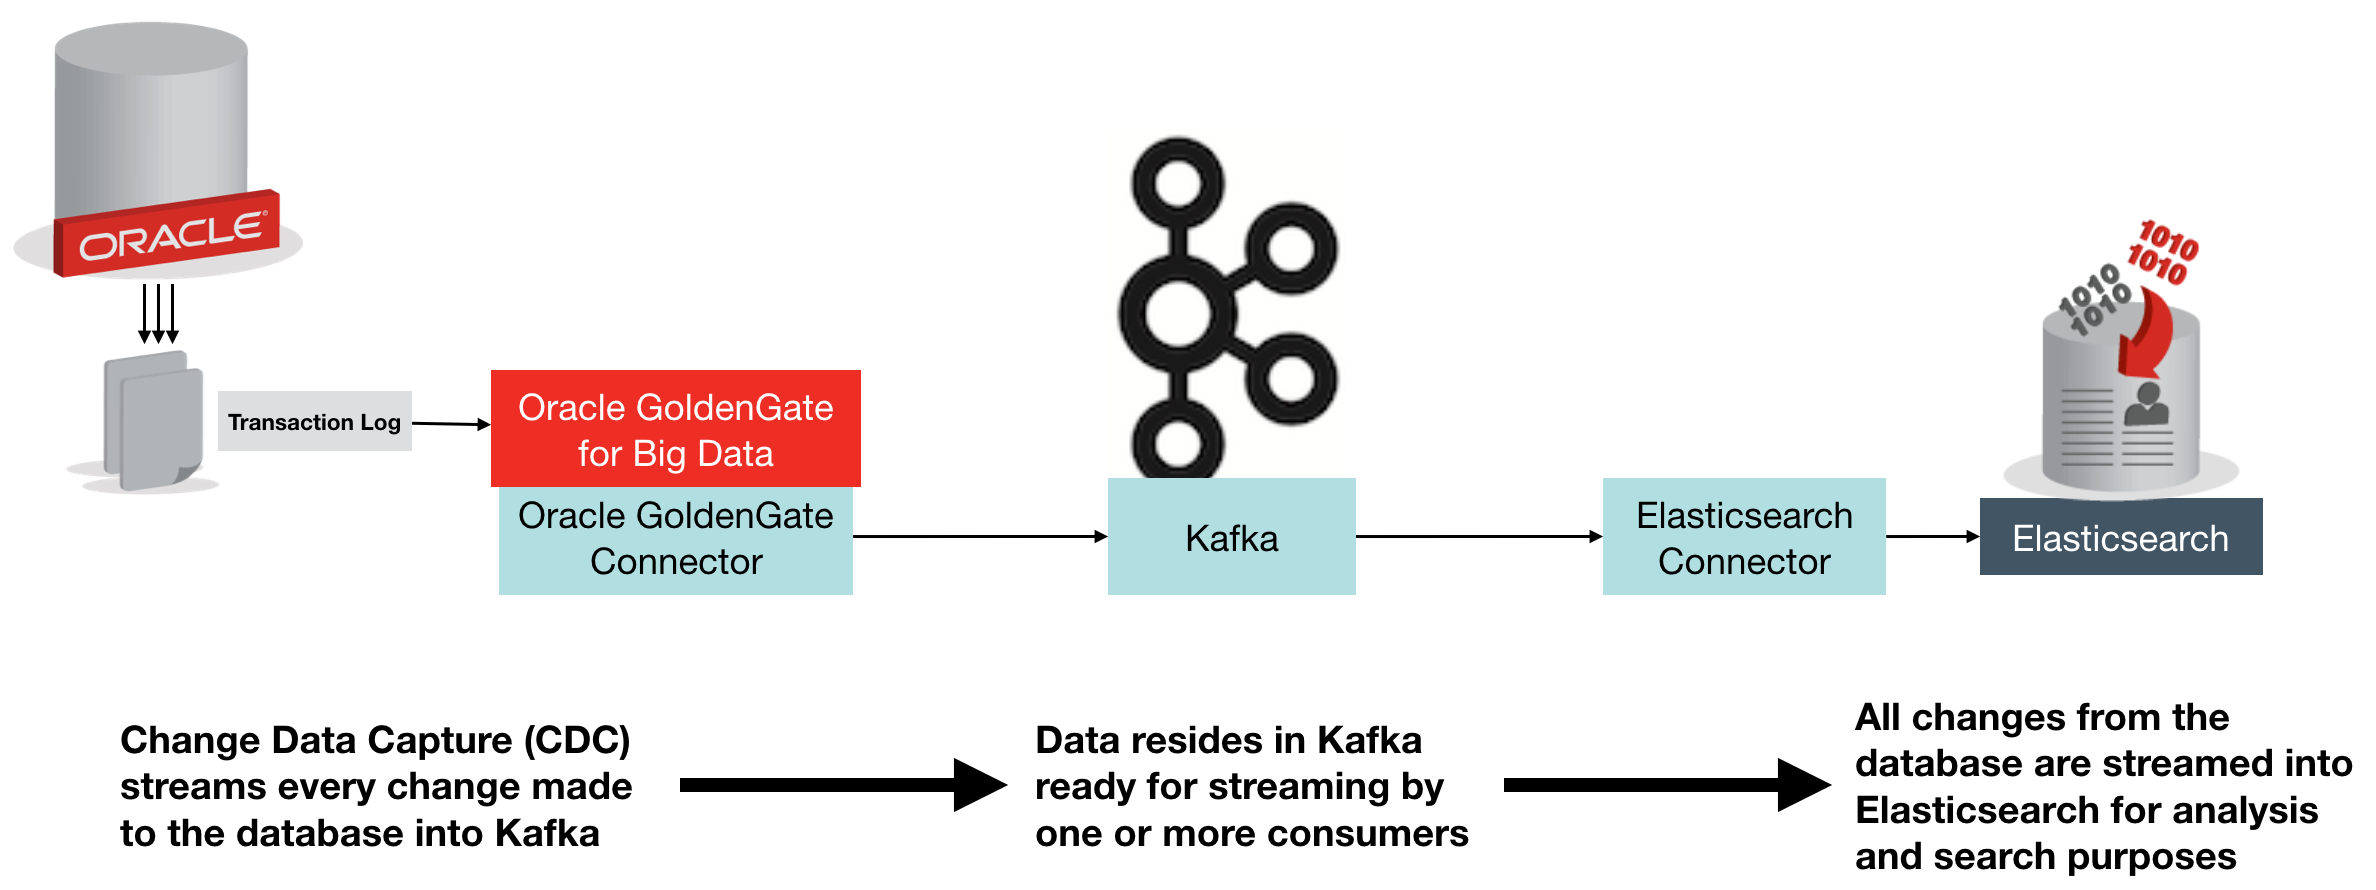
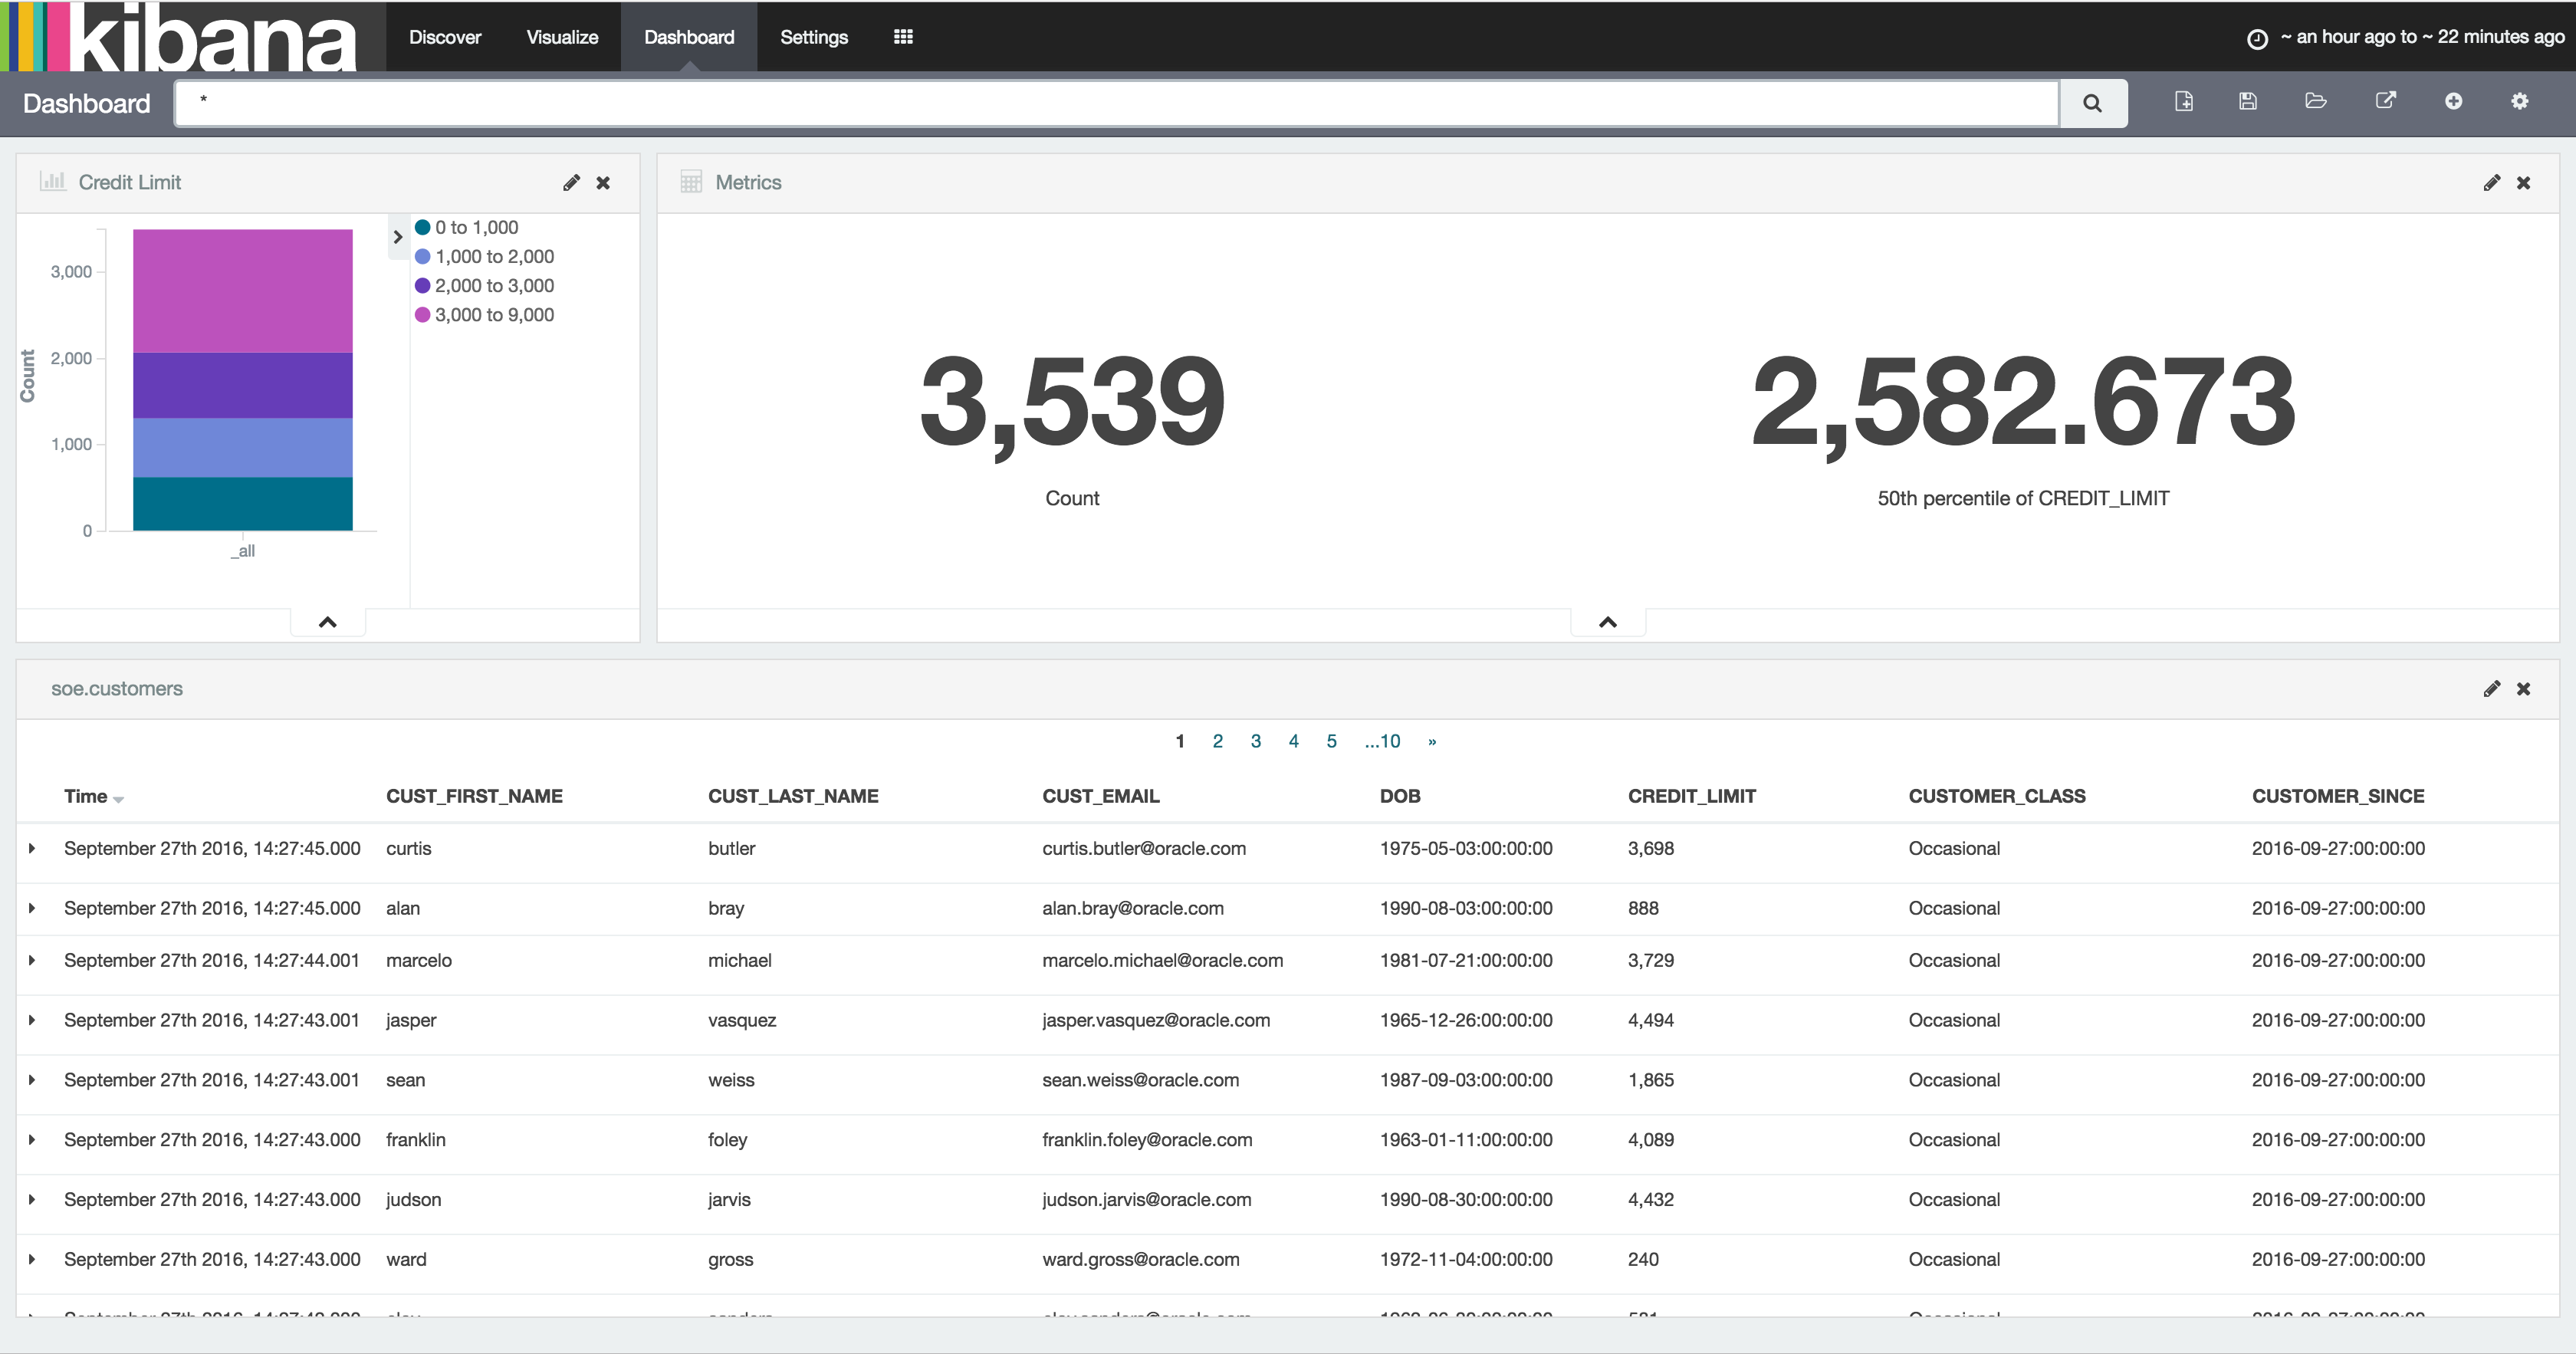
The above diagram shows an overview of what we're building. Change Data Capture (CDC) on the database streams every single change made to the data over to Kafka, from where it is streamed into Elasticsearch. Once in Elasticsearch it can be viewed in tools search as Kibana, for search and analytics:

Oracle GoldenGate (OGG) is a realtime data replication tool, falling under the broad umbrella of Change Data Capture (CDC) software, albeit at the high end in terms of functionality. It supports multiple RDBMS platforms, including - obviously - Oracle, as well as DB2, MySQL, and SQL Server. You can find the full certification list here. It uses log-based technology to stream all changes to a database from source, to target - which may be another database of the same type, or a different one. It is commonly used for data integration, as well as replication of data for availability purposes.
In the context of Kafka, Oracle GoldenGate provides a way of streaming all changes made to a table, or set of tables, and making them available to other processes in our data pipeline. These processes could include microservices relying on an up-to-date feed of data from a particular table, as well as persisting a replica copy of the data from the source system into a common datastore for analysis alongside data from other systems.
Elasticsearch is an open-source distributed document store, used heavily for both search, and analytics. It comes with some great tools including Kibana for data discovery and analysis, as well as a Graph tool. Whilst Elasticsearch is capable of being a primary data store in its own right, it is also commonly used as a secondary store in order to take advantage of its rapid search and analytics capabilities. It is the latter use-case that we're interested in here - using Elasticsearch to store a copy of data produced in Oracle.
Confluent's Elasticsearch Connector is an open source connector plug-in for Kafka Connect that sends data from Kafka to Elasticsearch. It is highly efficient, utilising Elasticsearch's bulk API. It also supports all Elasticsearch's data types which it automatically infers, and evolves the Elasticsearch mappings from the schema stored in Kafka records.
Oracle GoldenGate can be used with Kafka to directly stream every single change made to your database. Everything that happens in the database gets recorded in the transaction log (OGG or not), and OGG takes that ands sends it to Kafka. In this blog we're using Oracle as the source database, but don't forget that Oracle GoldenGate supports many sources. To use Oracle GoldenGate with Kafka, we use the "Oracle GoldenGate for Big Data" version (which has different binaries). Oracle GoldenGate has a significant advantage over the JDBC Source Connector for Kafka Connect in that it is a 'push' rather than periodic 'pull' from the source, thus it :
- Has much lower latency
- Requires less resource on the source database, since OGG mines the transaction log instead of directly querying the database for changes made based on a timestamp or key.
- Scales better, since entire schemas or whole databases can be replicated with minimal configuration changes. The JDBC connector requires each table, or SQL statement, to be specified.
Note that Oracle Golden Gate for Big Data also has its own native Kafka Handler, which can produce data in various formats directly to Kafka (rather than integrating with the Kafka Connect framework).
Environment
I'm using the Oracle BigDataLite VM 4.5 as the base machine for this. It includes Oracle 12c, Oracle GoldenGate for Big Data, as well as a CDH installation which provides HDFS and Hive for us to also integrate with later on.
On to the VM you need to also install:
- Confluent Plaform 3.0
- Oracle GoldenGate Kafka Connect connector
- Elasticsearch Kafka Connect connector
- Elasticsearch 2.4
To generate the schema and continuous workload, I used Swingbench 2.5.
For a step-by-step guide on how to set up these additional components, see this gist.
Starting Confluent Platform
There are three processes that need starting up, and each retains control of the session, so you'll want to use screen/tmux here, or wrap the commands in nohup [.. command ..] & so that they don't die when you close the window.
On BigDataLite the Zookeeper service is already installed, and should have started at server boot:
[oracle@bigdatalite ~]$ sudo service zookeeper-server status
zookeeper-server is running
If it isn't running, then start it with sudo service zookeeper-server start.
Next start up Kafka:
# On BigDataLite I had to remove this folder for Kafka to start
sudo rm -r /var/lib/kafka/.oracle_jre_usage
sudo /usr/bin/kafka-server-start /etc/kafka/server.properties
and finally the Schema Registry:
sudo /usr/bin/schema-registry-start /etc/schema-registry/schema-registry.properties
Note that on BigDataLite the Oracle TNS Listener is using port 8081 - the default for the Schema Registry - so I amended /etc/schema-registry/schema-registry.properties to change
listeners=http://0.0.0.0:8081
to
listeners=http://0.0.0.0:18081
Configuring Oracle GoldenGate to send transactions to Kafka Connect
Oracle GoldenGate (OGG) works on the concept of an Extract process which reads the source-specific transaction log and writes an OGG trail file in a generic OGG format. From this a Replicat process reads the trail file and delivers the transactions to the target.
In this example we'll be running the Extract against Oracle database, specifically, the SOE schema that Swingbench generated for us - and which we'll be able to generate live transactions against using Swingbench later on.
The Replicat will be sending the transactions from the trail file over to Kafka Connect.
I'm assuming here that you've already successfully defined and set running an extract against the Swingbench schema (SOE), with a trail file being delivered to /u01/ogg-bd/dirdat. For a step-by-step guide on how to do this all from scratch, see here.
You can find information about the OGG-Kafka Connect adapter in the README here.
To use it, first configure the replicat and supporting files as shown.
-
Replicat parameters
Create
/u01/ogg-bd/dirprm/rconf.prmwith the following contents:REPLICAT rconf TARGETDB LIBFILE libggjava.so SET property=dirprm/conf.props REPORTCOUNT EVERY 1 MINUTES, RATE GROUPTRANSOPS 1000 MAP *.*.*, TARGET *.*.*; -
Handler configuration
Edit the existing
/u01/ogg-bd/dirprm/conf.propsand amendgg.classpathas shown below. The classpath shown works for BigDataLite - on your own environment you need to make the necessary jar files available per the dependencies listed in the README.gg.handlerlist=confluent #The handler properties gg.handler.confluent.type=oracle.goldengate.kafkaconnect.KafkaConnectHandler gg.handler.confluent.kafkaProducerConfigFile=confluent.properties gg.handler.confluent.mode=tx gg.handler.confluent.sourceRecordGeneratorClass=oracle.goldengate.kafkaconnect.DefaultSourceRecordGenerator #The formatter properties gg.handler.confluent.format=oracle.goldengate.kafkaconnect.formatter.KafkaConnectFormatter gg.handler.confluent.format.insertOpKey=I gg.handler.confluent.format.updateOpKey=U gg.handler.confluent.format.deleteOpKey=D gg.handler.confluent.format.treatAllColumnsAsStrings=false gg.handler.confluent.format.iso8601Format=false gg.handler.confluent.format.pkUpdateHandling=abend goldengate.userexit.timestamp=utc goldengate.userexit.writers=javawriter javawriter.stats.display=TRUE javawriter.stats.full=TRUE gg.log=log4j gg.log.level=INFO gg.report.time=30sec #Set the classpath here gg.classpath=dirprm/:/u01/ogg-bd/ggjava/resources/lib*:/usr/share/java/kafka-connect-hdfs/*:/usr/share/java/kafka/* javawriter.bootoptions=-Xmx512m -Xms32m -Djava.class.path=.:ggjava/ggjava.jar:./dirprmNote the
gg.log.levelsetting - this can be very useful to switch toDEBUGif you're investigating problems with the handler. -
Kafka Connect settings
Edit the existing
/u01/ogg-bd/dirprm/confluent.propertiesand amend theschema.registry.urlURL to reflect the port change made above. All other values can be left as defaults.bootstrap.servers=localhost:9092 value.serializer=org.apache.kafka.common.serialization.ByteArraySerializer key.serializer=org.apache.kafka.common.serialization.ByteArraySerializer schema.registry.url=http://localhost:18081 value.converter=org.apache.kafka.connect.json.JsonConverter key.converter=org.apache.kafka.connect.json.JsonConverter internal.value.converter=org.apache.kafka.connect.json.JsonConverter internal.key.converter=org.apache.kafka.connect.json.JsonConverter
Now we can add the replicat. If not already, launch ggsci from the ogg-bd folder:
cd /u01/ogg-bd/
rlwrap ./ggsci
and define the replicat, and start it
ADD REPLICAT RCONF, EXTTRAIL ./dirdat/rt
START RCONF
Check its status:
GGSCI (bigdatalite.localdomain) 13> INFO RCONF
REPLICAT RCONF Last Started 2016-09-02 15:39 Status RUNNING
Checkpoint Lag 00:00:00 (updated 00:00:02 ago)
Process ID 25415
Log Read Checkpoint File ./dirdat/rt000000000
First Record RBA 0
Note that on BigDataLite 4.5 VM there are two existing replicats configured, RKAFKA and RMOV. You can ignore these, or delete them if you want to keep things simple and clear.
Testing the Replication
We'll run Swingbench in a moment to generate some proper throughput, but let's start with a single transaction to check things out.
Connect to Oracle and insert a row, not forgetting to commit the transaction (he says, from frustrating experience ;) )
[oracle@bigdatalite ogg]$ sqlplus soe/soe@orcl
SQL*Plus: Release 12.1.0.2.0 Production on Fri Sep 2 15:48:18 2016
Copyright (c) 1982, 2014, Oracle. All rights reserved.
Last Successful login time: Fri Sep 02 2016 12:48:22 +01:00
Connected to:
Oracle Database 12c Enterprise Edition Release 12.1.0.2.0 - 64bit Production
With the Partitioning, OLAP, Advanced Analytics and Real Application Testing options
SQL> insert into soe.logon values (42,42,sysdate);
1 row created.
SQL> commit;
Commit complete.
SQL> select * from soe.logon where logon_id=42;
LOGON_ID CUSTOMER_ID LOGON_DAT
---------- ----------- ---------
42 50865 12-AUG-11
42 42 02-SEP-16
Now if you list the topics defined within Kafka, you should see a new one has been created, for the SOE.LOGON table:
[oracle@bigdatalite dirrpt]$ kafka-topics --zookeeper localhost:2181 --list
SLF4J: Class path contains multiple SLF4J bindings.
SLF4J: Found binding in [jar:file:/usr/lib/zookeeper/lib/slf4j-log4j12-1.7.5.jar!/org/slf4j/impl/StaticLoggerBinder.class]
SLF4J: Found binding in [jar:file:/usr/share/java/kafka/slf4j-log4j12-1.7.21.jar!/org/slf4j/impl/StaticLoggerBinder.class]
SLF4J: See http://www.slf4j.org/codes.html#multiple_bindings for an explanation.
SLF4J: Actual binding is of type [org.slf4j.impl.Log4jLoggerFactory]
ORCL.SOE.LOGON
_schemas
and you can view the record:
[oracle@bigdatalite dirrpt]$ kafka-console-consumer --zookeeper localhost:2181 --topic ORCL.SOE.LOGON --from-beginning
{"schema":{"type":"struct","fields":[{"type":"string","optional":false,"field":"table"},{"type":"string","optional":false,"field":"op_type"},{"type":"string","optional":false,"field":"op_ts"},{"type":"string","optional":false,"field":"current_ts"},{"type":"string","optional":false,"field":"pos"},{"type":"double","optional":true,"field":"LOGON_ID"},{"type":"double","optional":true,"field":"CUSTOMER_ID"},{"type":"string","optional":true,"field":"LOGON_DATE"}],"optional":false,"name":"ORCL.SOE.LOGON"},"payload":{"table":"ORCL.SOE.LOGON","op_type":"I","op_ts":"2016-09-02 14:56:26.000411","current_ts":"2016-09-02 15:56:34.111000","pos":"00000000000000002010","LOGON_ID":42.0,"CUSTOMER_ID":42.0,"LOGON_DATE":"2016-09-02:15:56:25"}}
Hit Ctrl-C to cancel the consumer -- otherwise it'll sit there and wait for additional messages to be sent to the topic. Useful for monitoring when we've got lots of records flowing through, but not so useful now.
The message is JSON, so a useful tool to install is jq:
sudo yum install -y jq
You can then pipe the output of kafka-console-consumer through jq to pretty-print it:
[oracle@bigdatalite dirrpt]$ kafka-console-consumer --zookeeper localhost:2181 --topic ORCL.SOE.LOGON --from-beginning|jq '.'
{
"payload": {
"LOGON_DATE": "2016-09-02:15:56:25",
"CUSTOMER_ID": 42,
"LOGON_ID": 42,
"pos": "00000000000000002010",
"current_ts": "2016-09-02 15:56:34.111000",
"op_ts": "2016-09-02 14:56:26.000411",
"op_type": "I",
"table": "ORCL.SOE.LOGON"
},
[...]
or even show just sections of the message using jq's syntax (explore it here):
[oracle@bigdatalite dirrpt]$ kafka-console-consumer --zookeeper localhost:2181 --topic ORCL.SOE.LOGON --from-beginning|jq '.payload.op_ts'
"2016-09-02 14:56:26.000411"
So we've got successful replication of Oracle transactions into Kafka, via Oracle GoldenGate. Now let's bring Elasticsearch into the mix.
Configuring Elasticsearch
We're going to use Elasticsearch as a destination for storing the data coming through Kafka from Oracle. Each Oracle table will map to a separate Elasticsearch index. In Elasticsearch an 'index' is roughly akin to an RDBMS table, a 'document' to a row, a 'field' to a column, and a 'mapping' to a schema.
Elasticsearch itself needs no configuration out of the box if you want to just get up and running with it, you simply execute it:
/opt/elasticsearch-2.4.0/bin/elasticsearch
Note that this wouldn't suffice for a Production deployment, in which you'd want to allocate heap space, check open file limits, configure data paths, and so on.
With Elasticsearch running, you can then load Kopf, which is a web-based admin plugin. You'll find it at http://<server>:9200/_plugin/kopf

From Kopf you can see which nodes there are in the Elasticsearch cluster (just the one at the moment, with a random name inspired by Marvel), along with details of the indices as they're created - in the above screenshot there are none yet, because we've not loaded any data.
Setting up the Elasticsearch Kafka Connect handler
Create a configuration file for the Elasticsearch Kafka Connect handler. I've put it in with the Elasticsearch configuration itself at /opt/elasticsearch-2.4.0/config/elasticsearch-kafka-connect.properties; you can use other paths if you want.
The defaults mostly suffice to start with, but we do need to update the topics value:
name=elasticsearch-sink
connector.class=io.confluent.connect.elasticsearch.ElasticsearchSinkConnector
tasks.max=1
connection.url=http://localhost:9200
type.name=kafka-connect
# Custom config
topics=ORCL.SOE.LOGON
Because Elasticsearch indices cannot be uppercase, we need to provide a mapping from the Kafka topic to the Elasticsearch index, so add a configuration to the file:
topic.index.map=ORCL.SOE.LOGON:soe.logon
If you don't do this you'll get an InvalidIndexNameException. You also need to add
topic.key.ignore = ORCL.SOE.LOGON
Note that the global key.ignore is currently ignored if you are also overriding another topic parameter. If you don't set this flag for the topic, you'll get org.apache.kafka.connect.errors.DataException: STRUCT is not supported as the document id..
Now we can run our connector. I'm setting the CLASSPATH necessary to pick up the connector itself, as well as the dependecies. I also set JMX_PORT so that the metrics are exposed on JMX for helping with debug/monitoring.
export CLASSPATH=/opt/kafka-connect-elasticsearch/*
export JMX_PORT=4243
/usr/bin/connect-standalone /etc/kafka/connect-standalone.properties /opt/elasticsearch-2.4.0/config/elasticsearch-kafka-connect.properties
You'll not get much from the console after the initial flurry of activity, except:
[pool-2-thread-1] INFO org.apache.kafka.connect.runtime.WorkerSinkTask - WorkerSinkTask{id=elasticsearch-sink-0} Committing offsets
But if you head over to Elasticsearch you should now have some data. In Kopf you'll see that there are now 'documents' in the index:
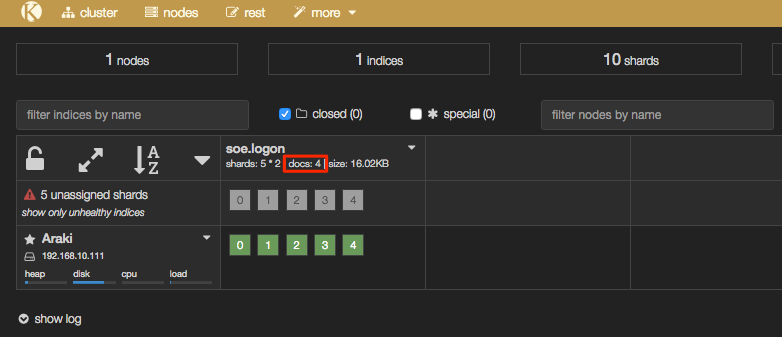
In addition the header bar of Kopf has gone a yellow/gold colour, because your Elasticsearch cluster is now in "YELLOW" state - we'll come back to this and the cause (unassigned shards) shortly.
Interactions with Elasticsearch are primarily through a REST API, which you can use to query the number of records in an index:
[oracle@bigdatalite ~]$ curl -s -X "GET" "http://localhost:9200/soe.logon/_count?pretty=true"
{
"count" : 4,
"_shards" : {
"total" : 5,
"successful" : 5,
"failed" : 0
}
}
and you can pair it up with jq as above to select just one of the fields:
$ curl -s -X "GET" "http://localhost:9200/soe.logon/_count?pretty=true"|jq '.count'
4
To see the data itself:
$ curl -s -X "GET" "http://localhost:9200/soe.logon/_search?pretty=true"
{
"took" : 25,
"timed_out" : false,
"_shards" : {
"total" : 5,
"successful" : 5,
"failed" : 0
},
"hits" : {
"total" : 4,
"max_score" : 1.0,
"hits" : [ {
"_index" : "soe.logon",
"_type" : "kafka-connect",
"_id" : "ORCL.SOE.LOGON+0+3",
"_score" : 1.0,
"_source" : {
"table" : "ORCL.SOE.LOGON",
"op_type" : "I",
"op_ts" : "2016-09-05 14:46:16.000436",
"current_ts" : "2016-09-05 15:46:21.860000",
"pos" : "00000000000000002748",
"LOGON_ID" : 42.0,
"CUSTOMER_ID" : 42.0,
"LOGON_DATE" : "2016-09-05:15:46:11"
}
},
This is looking good! But ... there's a wrinkle. Let's fire up Kibana, an analytical tool for data in Elasticsearch, and see why.
/opt/kibana-4.6.0-linux-x86_64/bin/kibana
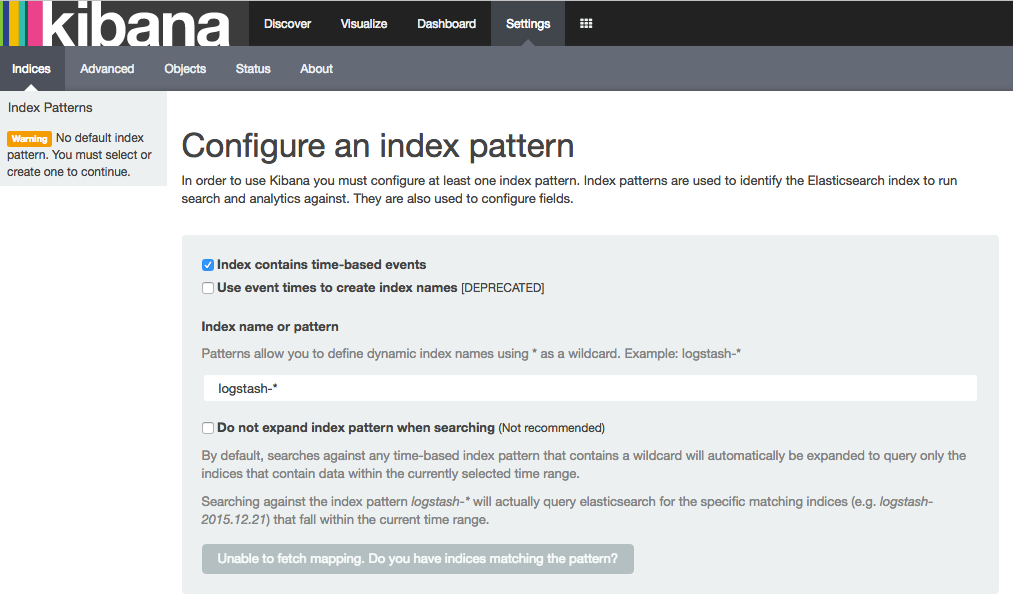
Go to http://<server>:5601/ and the first thing you'll see (assuming this is the first time you've run Kibana) is this:
Elasticseach, Index Mappings, and Dynamic Templates
Kibana is a pretty free-form analysis tool, and you don't have to write SQL, define dimensions, and so on -- but what you do have to do is tell it where to find the data. So let's specify our index name, which in this example is soe.logon:
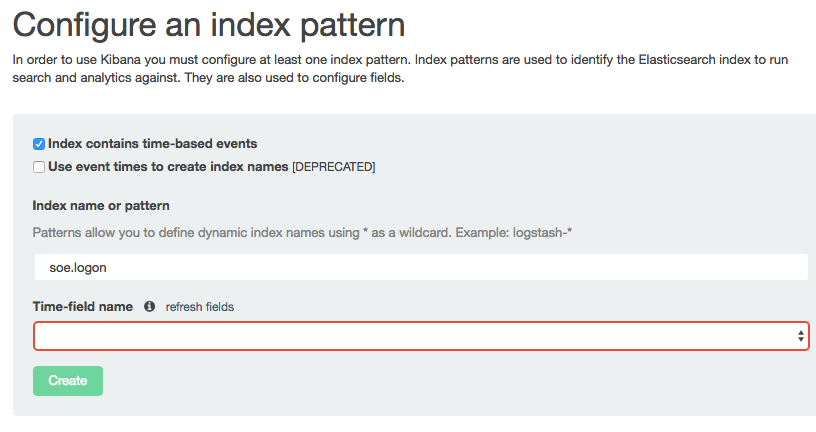
Note that the Time-field name remains blank. If you untick Index contains time-based events and then click Create you'll see the index fields and their types:
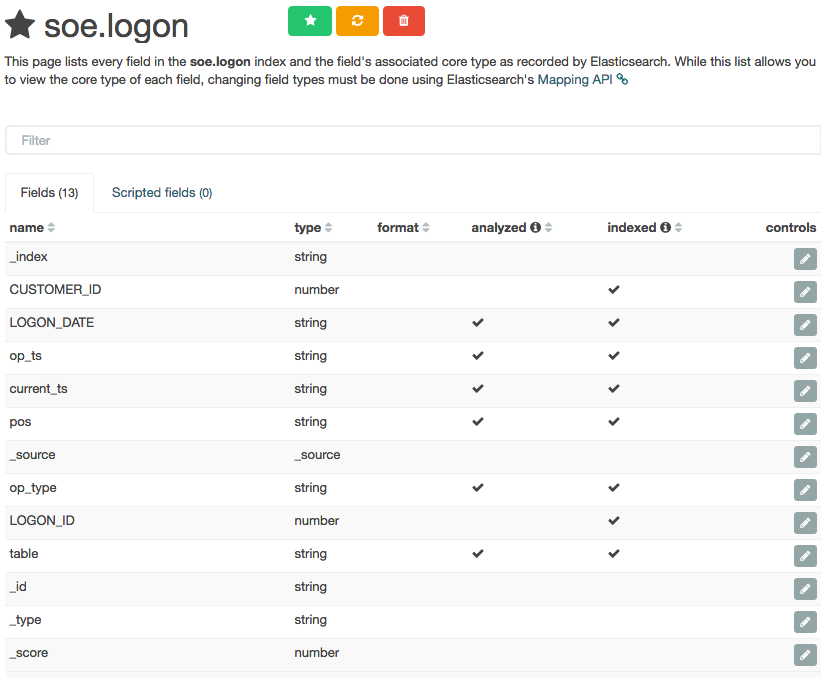
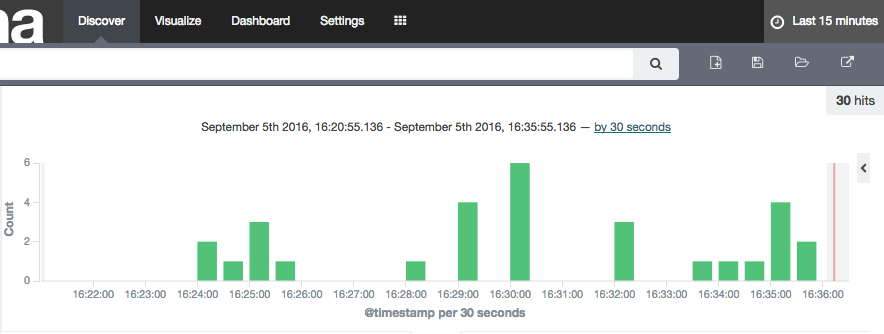
Columns that are timestamps are coming across as strings - which is an issue here, because Time is one of the dimensions by which we'll pretty much always want to analyse data, and if it's not present Kibana (or any other user of the Elasticsearch data) can't do its clever time-based filtering and aggregation, such as this example taken from another (time-based) Elasticsearch index:
As a side note, the schema coming through from OGG Kafka Connect connector is listing these timestamp fields as strings, as we can see with a bit of fancy jq processing to show the schema entry for one of the fields (op_ts):
$ kafka-console-consumer --zookeeper localhost:2181 --topic ORCL.SOE.LOGON --from-beginning --max-messages 1|jq '.schema.fields[] | select (.field | contains("op_ts"))'
{
"field": "op_ts",
"optional": false,
"type": "string"
}
This string-based schema is actually coming through from the OGG replicat itself - whilst the Kafka Connect handler interprets and assumes the datatypes of columns such as numbers, it doesn't for timestamps.
So - how do we fix these data types in Elasticsearch so that we can make good use of the data? Enter Dynamic Templates. These enable you to specify the mapping (similar to a schema) of an index prior to it being created for a field for the first time, and you can wildcard field names too so that, for example, anything with a _ts suffix is treated as a timestamp data type.
To configure the dynamic template we'll use the REST API again, and whilst curl is fine for simple and repeated command line work, we'll switch to the web-based Elasticsearch REST API client, Sense. Assuming that you installed it following the process above you can access it at http://<server>:5601/app/sense.
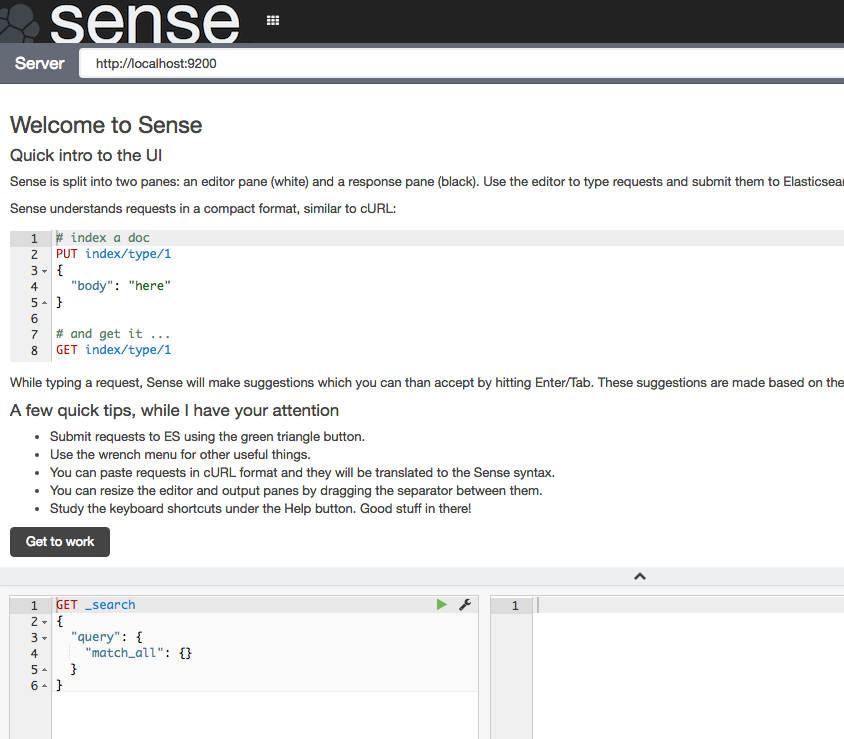
Click Get to work to close the intro banner, and in the main editor paste the following JSON (gist here)
DELETE /_template/kafkaconnect/
PUT /_template/kafkaconnect/
{
"template": "soe*",
"settings": {
"number_of_shards": 1,
"number_of_replicas": 0
},
"mappings": {
"_default_": {
"dynamic_templates": [
{
"dates": {
"match": "*_ts",
"mapping": {
"type": "date",
"format": "YYYY-MM-dd HH:mm:ss.SSSSSS"
}
}
},
{
"non_analysed_string_template": {
"match": "*",
"match_mapping_type": "string",
"mapping": {
"type": "string",
"index": "not_analyzed"
}
}
}
]
}
}
}
What this is doing:
- The
DELETEis just there so that you can re-run these statements, since Elasticsearch won't update an existing template. - Any index beginning with
soewill be matched against this template. - This is based on a single-node Elasticsearch instance, so setting the number of replicas to zero, and shards to one. In a multi-node Production cluster you'd want to set these differently. If you leave replicas as the default (1) then your Elasticsearch cluster will remain in "YELLOW" health status as there'll forever be unassigned shards.
- The
datestemplate matches any field with_tssuffix and sets it to a Date type. The inbound data must match the format shown. For details of the date format specifics, see the JodaTime documentation. - The
non_analysed_string_templatetemplate matches any string field and creates two instances of it; one analyzed and one not. Analyzed is where it gets tokenized which is useful for full-text searching etc, and non-analyzed is necessary for aggregations against the full field value. For example, "New York" would otherwise aggregate as 'New' and a separate instance 'York'.
Put the cursor over each statement and click the green play arrow that appears to the right of the column.
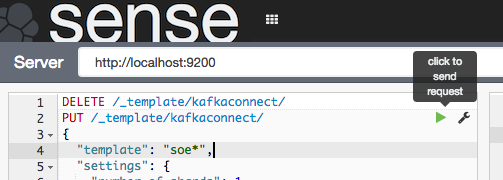
For the DELETE statement you'll get an error the first time it's run (because the index template isn't there to delete), and the PUT should succeed with
{
"acknowledged": true
}
Now we'll delete the index itself so that it can be recreated and pick up the dynamic mappings. Here I'm using curl but you can run this in Sense too if you want.
$ curl -X "DELETE" "http://localhost:9200/soe.logon"
{"acknowledged":true}
Watch out here, because Elasticsearch will delete an index before you can say 'oh sh....' -- there is no "Are you sure you want to drop this index?" type interaction. You can even wildcard the above REST request for real destruction and mayhem - action.destructive_requires_name can be set to limit this risk.
So, to recap - we've successfully run Kafka Connect to load data from a Kafka topic into an Elasticsearch index. We've taken that index and seen that the field mappings aren't great for timestamp fields, so have defined a dynamic template in Elasticsearch so that new indices created will set any column ending _ts to a timestamp. Finally, we deleted the existing index so that we can use the new template from now on.
Let's test out the new index mapping. Since we deleted the index that had our data in (albeit test data) we can take advantage of the awesomeness that is Kafka by simply replaying the topic from the start. To do this change the name value in the Elasticsearch connector configuration (elasticsearch-kafka-connect.properties), e.g. add a number to its suffix:
name=elasticsearch-sink-01
If you're running Kafka Connect in standalone mode then you could also just delete the offsets file to achieve the same.
Whilst in the configuration file you need to also add another entry, telling the connector to ignore the schema that is passed from Kafka and instead dynamically infer the types (as well as honour the dynamic mappings that we specified)
topic.schema.ignore=ORCL.SOE.LOGON
Now restart the connector (make sure you did delete the Elasticsearch index per above, otherwise you'll see no difference in the mappings)
export CLASSPATH=/opt/kafka-connect-elasticsearch/*
export JMX_PORT=4243
/usr/bin/connect-standalone /etc/kafka/connect-standalone.properties /opt/elasticsearch-2.4.0/config/elasticsearch-kafka-connect.properties
And go check out Elasticsearch, first the mapping:
$ curl -X "GET" "http://localhost:9200/soe.logon/_mapping?pretty"
{
"soe.logon" : {
"mappings" : {
[...]
"LOGON_ID" : {
"type" : "double"
},
"current_ts" : {
"type" : "date",
"format" : "YYYY-MM-dd HH:mm:ss.SSSSSS"
},
"op_ts" : {
"type" : "date",
"format" : "YYYY-MM-dd HH:mm:ss.SSSSSS"
[...]
Note that the two timestamp columns are now date type. If you still see them as strings, make sure you've set the topic.schema.ignore configuration as shown above in the Kafka Connect properties for the Elasticsearch connector.
Looking at the row count, we can see that all the records from the topic have been successfully replayed from Kafka and loaded into Elasticsearch. This ability to replay data on demand whilst developing and testing the ingest into a subsequent pipeline is a massive benefit of using Kafka!
$ curl -s -X "GET" "http://localhost:9200/soe.logon/_count?pretty=true"|jq '.count'
16
Over in Kibana head to the Index Patterns setting page (http://<server>:5601/app/kibana#/settings/indices), or from the Settings -> Indices menu buttons at the top. If you already have the index defined here then delete it - we want Kibana to pick up the new shiny version we've created because it includes the timestamp columns. Now configure a new index pattern:
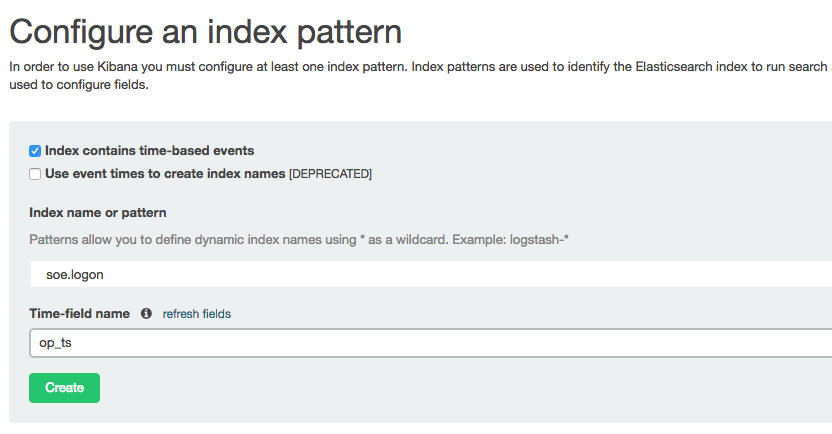
Note that the Time-field name field is now populated. I've selected op_ts. Click on Create and then go to the Discover page (from the option at the top of the page). You may well see "No results found" - if so use the button in the top-right of the page to change the time window to broaden it to include the time at which you inserted record(s) to the SOE.LOGON table in the testing above.

To explore the data further you can click on the add button that you get when hovering over each of the fields on the left of the page, which will add them as columns to the main table, replacing the default _source (which shows all fields):
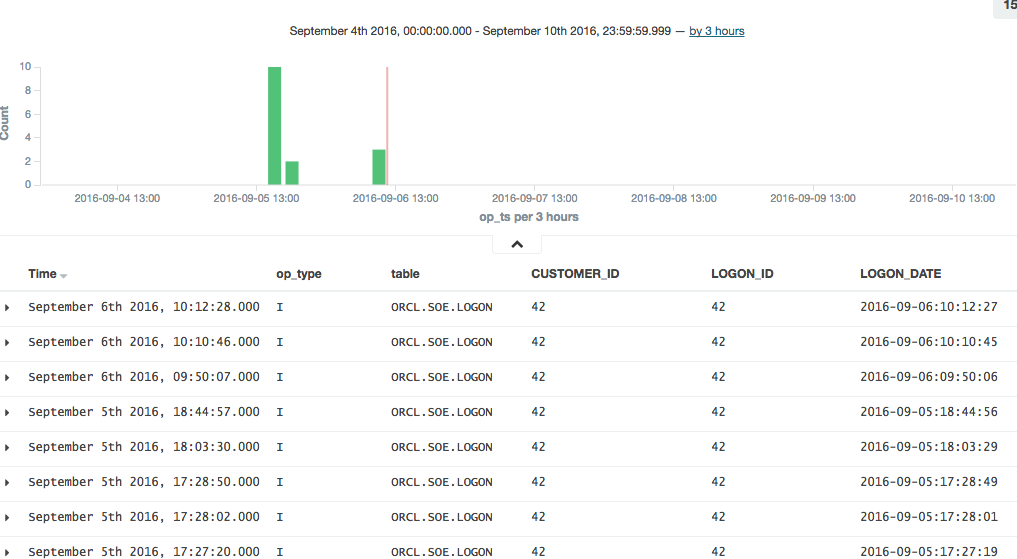
In this example you can see that there was quite a few testing records inserted (op_type = I), with nothing changing between than the LOGON_DATE.
Connector errors after adding dynamic templates
Note that if you get an error like this when running the connector:
[pool-2-thread-1] ERROR org.apache.kafka.connect.runtime.WorkerSinkTask - Task elasticsearch-sink-02-0 threw an uncaught and unrecoverable exception
org.apache.kafka.connect.errors.ConnectException: Cannot create mapping:{"kafka-connect":{"properties":{"[...]
at io.confluent.connect.elasticsearch.Mapping.createMapping(Mapping.java:65)
then check the Elasticsearch log/stdout, where you'll find more details. This kind of thing that can cause problems would be an index not deleted before re-running it with the new template, as well as a date format in the template that doesn't match the data.
Running a Full Swingbench Test
Configuration
If you've made it this far, congratulations! Now we're going to set up the necessary configuration to run Swingbench. This will generate a stream of changes to multiple tables, enabling us to get a feel for how the pipeline behaves in 'real world' conditions.
To start will, let's get a list of all the tables involved:
$ rlwrap sqlplus soe/soe@orcl
SQL*Plus: Release 12.1.0.2.0 Production on Tue Sep 6 11:45:02 2016
Copyright (c) 1982, 2014, Oracle. All rights reserved.
Last Successful login time: Fri Sep 02 2016 15:49:03 +01:00
Connected to:
Oracle Database 12c Enterprise Edition Release 12.1.0.2.0 - 64bit Production
With the Partitioning, OLAP, Advanced Analytics and Real Application Testing options
SQL> select table_name from user_tables;
TABLE_NAME
--------------------------------------------------------------------------------
WAREHOUSES
PRODUCT_INFORMATION
PRODUCT_DESCRIPTIONS
ORDER_ITEMS
ORDERS
ORDERENTRY_METADATA
LOGON
INVENTORIES
CUSTOMERS
CARD_DETAILS
ADDRESSES
11 rows selected.
SQL>
The OGG replication is already defined with a wildcard, to pick up all tables in the SOE schema:
[oracle@bigdatalite config]$ cat /u01/ogg/dirprm/ext1.prm
EXTRACT EXT1
USERID SYSTEM, PASSWORD welcome1
EXTTRAIL ./dirdat/lt
SOURCECATALOG ORCL
TABLE SOE.*;
[oracle@bigdatalite config]$ cat /u01/ogg-bd/dirprm/rconf.prm
 REPLICAT rconf
 TARGETDB LIBFILE libggjava.so SET property=dirprm/conf.props
 REPORTCOUNT EVERY 1 MINUTES, RATE
 GROUPTRANSOPS 1000
 MAP *.*.*, TARGET *.*.*;
The OGG Kafka Connect handler will automatically create a topic for every table that it receives from OGG. So all we need to do now is add each table to the Elasticsearch Sink configuration. For this, I created a second version of the configuration file, at /opt/elasticsearch-2.4.0/config/elasticsearch-kafka-connect-full.properties
name=elasticsearch-sink-full-00
connector.class=io.confluent.connect.elasticsearch.ElasticsearchSinkConnector
tasks.max=1
connection.url=http://localhost:9200
type.name=kafka-connect
topics=ORCL.SOE.WAREHOUSES ,ORCL.SOE.PRODUCT_INFORMATION ,ORCL.SOE.PRODUCT_DESCRIPTIONS ,ORCL.SOE.ORDER_ITEMS ,ORCL.SOE.ORDERS ,ORCL.SOE.ORDERENTRY_METADATA ,ORCL.SOE.LOGON ,ORCL.SOE.INVENTORIES ,ORCL.SOE.CUSTOMERS ,ORCL.SOE.CARD_DETAILS ,ORCL.SOE.ADDRESSES
topic.schema.ignore=ORCL.SOE.WAREHOUSES ,ORCL.SOE.PRODUCT_INFORMATION ,ORCL.SOE.PRODUCT_DESCRIPTIONS ,ORCL.SOE.ORDER_ITEMS ,ORCL.SOE.ORDERS ,ORCL.SOE.ORDERENTRY_METADATA ,ORCL.SOE.LOGON ,ORCL.SOE.INVENTORIES ,ORCL.SOE.CUSTOMERS ,ORCL.SOE.CARD_DETAILS ,ORCL.SOE.ADDRESSES
topic.key.ignore=ORCL.SOE.WAREHOUSES ,ORCL.SOE.PRODUCT_INFORMATION ,ORCL.SOE.PRODUCT_DESCRIPTIONS ,ORCL.SOE.ORDER_ITEMS ,ORCL.SOE.ORDERS ,ORCL.SOE.ORDERENTRY_METADATA ,ORCL.SOE.LOGON ,ORCL.SOE.INVENTORIES ,ORCL.SOE.CUSTOMERS ,ORCL.SOE.CARD_DETAILS ,ORCL.SOE.ADDRESSES
topic.index.map=ORCL.SOE.WAREHOUSES:soe.warehouses ,ORCL.SOE.PRODUCT_INFORMATION:soe.product_information ,ORCL.SOE.PRODUCT_DESCRIPTIONS:soe.product_descriptions ,ORCL.SOE.ORDER_ITEMS:soe.order_items ,ORCL.SOE.ORDERS:soe.orders ,ORCL.SOE.ORDERENTRY_METADATA:soe.orderentry_metadata ,ORCL.SOE.LOGON:soe.logon ,ORCL.SOE.INVENTORIES:soe.inventories ,ORCL.SOE.CUSTOMERS:soe.customers ,ORCL.SOE.CARD_DETAILS:soe.card_details ,ORCL.SOE.ADDRESSES:soe.addresses
Having created the configuration, run the connector. If the previous connector from the earlier testing is running then stop it first, otherwise you'll get a port clash (and be double-processing the ORCL.SOE.LOGON topic).
/usr/bin/connect-standalone /etc/kafka/connect-standalone.properties /opt/elasticsearch-2.4.0/config/elasticsearch-kafka-connect-full.properties
Running Swingbench
I'm using charbench which is a commandline interface for Swingbench:
$ /opt/swingbench/bin/charbench -cs localhost:1521/orcl -u soe -p soe -v trans,users
Author  :        Dominic Giles
Version :        2.5.0.971

Results will be written to results.xml.
Hit Return to Terminate Run...

Time            NCR     UCD     BP      OP      PO      BO      SQ      WQ      WA      Users
06:59:14        0       0       0       0       0       0       0       0       0       [0/1]
06:59:15        0       0       0       0       0       0       0       0       0       [0/1]
06:59:16        0       0       0       0       0       0       0       0       0       [0/1]
06:59:17        0       0       0       0       0       0       0       0       0       [0/1]
06:59:18        0       0       0       0       0       0       0       0       0       [0/1]
06:59:19        0       0       0       0       0       0       0       0       0       [0/1]
06:59:20        0       0       0       0       0       0       0       0       0       [0/1]
06:59:21        0       0       0       0       0       0       0       0       0       [0/1]
06:59:22        0       0       0       0       0       0       0       0       0       [1/1]
06:59:23        2       0       2       0       0       0       0       0       0       [1/1]
06:59:24        3       0       4       5       0       0       0       0       0       [1/1]
Each of the columns with abbreviated headings are different transactions run, and as soon as you see numbers above zero in them it indicates that you should be getting data in the Oracle tables, and thus through into Kafka and Elasticsearch.
Auditing the Pipeline
Let's see how many records are on the ORDERS table:
$ rlwrap sqlplus soe/soe@orcl

SQL*Plus: Release 12.1.0.2.0 Production on Tue Sep 6 12:21:13 2016

Copyright (c) 1982, 2014, Oracle.  All rights reserved.

Last Successful login time: Tue Sep 06 2016 12:21:09 +01:00

Connected to:
Oracle Database 12c Enterprise Edition Release 12.1.0.2.0 - 64bit Production
With the Partitioning, OLAP, Advanced Analytics and Real Application Testing options

SQL> select count(*) from orders;

COUNT(*)
----------
143001
But, this includes the records that were pre-seeded by Swingbench before we set up the OGG extract. How do we know how many have been read by GoldenGate since, and should therefore be downstream on Kafka, and Elasticsearch? Enter logdump. This is a GoldenGate tool that gives a commandline interface to analysing the OGG trail file itself. You can read more about it here, here, and here.
First, determine the trail file name:
$ ls -l /u01/ogg/dirdat/*
-rw-r-----. 1 oracle oinstall 64068 Sep  9 10:16 /u01/ogg/dirdat/lt000000015
And then launch logdump (optionally, but preferably, with rlwrap to give command history and search):
$ cd /u01/ogg/
$ rlwrap ./logdump
From the Logdump > prompt, open the trail file:
Logdump 1 >OPEN /u01/ogg/dirdat/lt000000015
Current LogTrail is /u01/ogg/dirdat/lt000000015
and then filter to only show records relating to the table we're interested in:
Logdump 2 >FILTER FILENAME ORCL.SOE.ORDERS
and then give a summary of the records present:
Logdump 3 >COUNT
LogTrail /u01/ogg/dirdat/lt000000015 has 46 records
Total Data Bytes              14056
  Avg Bytes/Record              305
Insert                           22
Update                           23
Metadata Records                  1
After Images                     45
Filtering matched           46 records
          suppressed       208 records
Here we can see that there are a total of 45 insert/update records that have been captured.
Let's check the replicat's trail file also matches:
$ ls -l /u01/ogg-bd/dirdat/*
-rw-r-----. 1 oracle oinstall 64416 Sep  9 10:16 /u01/ogg-bd/dirdat/rt000000000

$ cd /u01/ogg-bd
$ rlwrap ./logdump

Oracle GoldenGate Log File Dump Utility
Version 12.2.0.1.160419 OGGCORE_12.2.0.1.0OGGBP_PLATFORMS_160430.1401

Copyright (C) 1995, 2016, Oracle and/or its affiliates. All rights reserved.


Logdump 1 >OPEN /u01/ogg-bd/dirdat/rt000000000
Current LogTrail is /u01/ogg-bd/dirdat/rt000000000
Logdump 2 >FILTER FILENAME ORCL.SOE.ORDERS
Logdump 3 >COUNT
LogTrail /u01/ogg-bd/dirdat/rt000000000 has 46 records
Total Data Bytes              14056
  Avg Bytes/Record              305
Insert                           22
Update                           23
Metadata Records                  1
After Images                     45
Filtering matched           46 records
          suppressed       213 records

Average of 3 Transactions
Bytes/Trans .....       5421
Records/Trans ...         15
Files/Trans .....          4
Looks good - a total of 45 records again.
So from OGG, the data flows via the Kafka Connect connect into a Kafka topic, one per table. We can count how many messages there are on the corresponding Kafka topic by running a console consumer, redirecting the messages to file (and using & to return control to the console):
$ kafka-console-consumer --zookeeper localhost:2181 --topic ORCL.SOE.ORDERS --from-beginning > /tmp/kafka_orcl.soe.orders &
and then issue a wc to count the number of lines currently in the resulting file:
$  wc -l /tmp/kafka_orcl.soe.orders
45 /tmp/kafka_orcl.soe.orders
Since the console consumer process is still running in the background (type fg to bring it back to the foreground if you want to cancel it), you can re-issue the wc as required to see the current count of messages on the topic.
Finally, to see the number of documents on the corresponding Elasticsearch index:
$ curl -s -X "GET" "http://localhost:9200/soe.orders/_count?pretty=true"|jq '.count'
45
Here we've proved that the number of records written by Oracle are making it all the way through our pipeline.
Monitoring the Pipeline
Kafka and Kafka Connect expose metrics through JMX. There's a variety of tools for capturing, persisting, and visualising this, such as detailed here. For now, we'll just use JConsole to inspect the metrics and get an idea of what's available.
You'll need a GUI for jconsole, so either a desktop session on the server itself, X11 forwarded, or you can also run JConsole from a local machine (it's bundled with any JDK) and connect to the remote JMX. In this example I simply connected to the VM's desktop and ran JConsole locally there. You launch it by running it from the shell prompt:
$ jconsole
From here I connected to the 'Remote Process' on localhost:4242 to access the Kafka server process (because it's running as root the jconsole process (running as a non-root user) can't connect to it as a 'Local Process'). The port 4242 is what I specified as an environment variable as part of the kafka process launch.
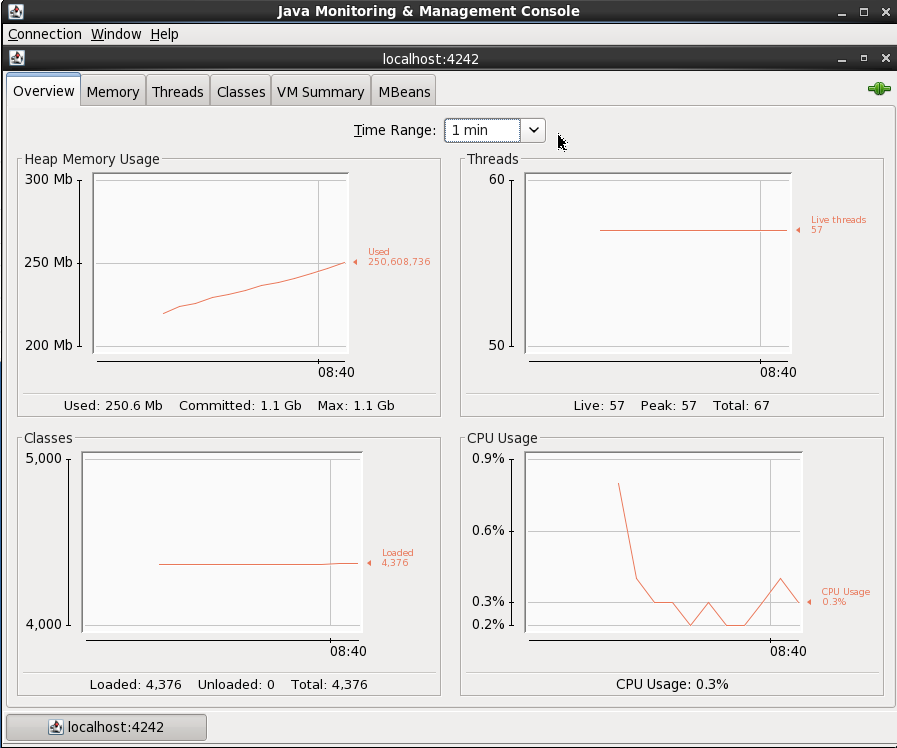
On the MBeans tab there are a list of MBeans under which the bespoke application metrics (as opposed to JVM ones like heap memory usage) are found. For example, the rate at which data is being received and sent from the cluster:
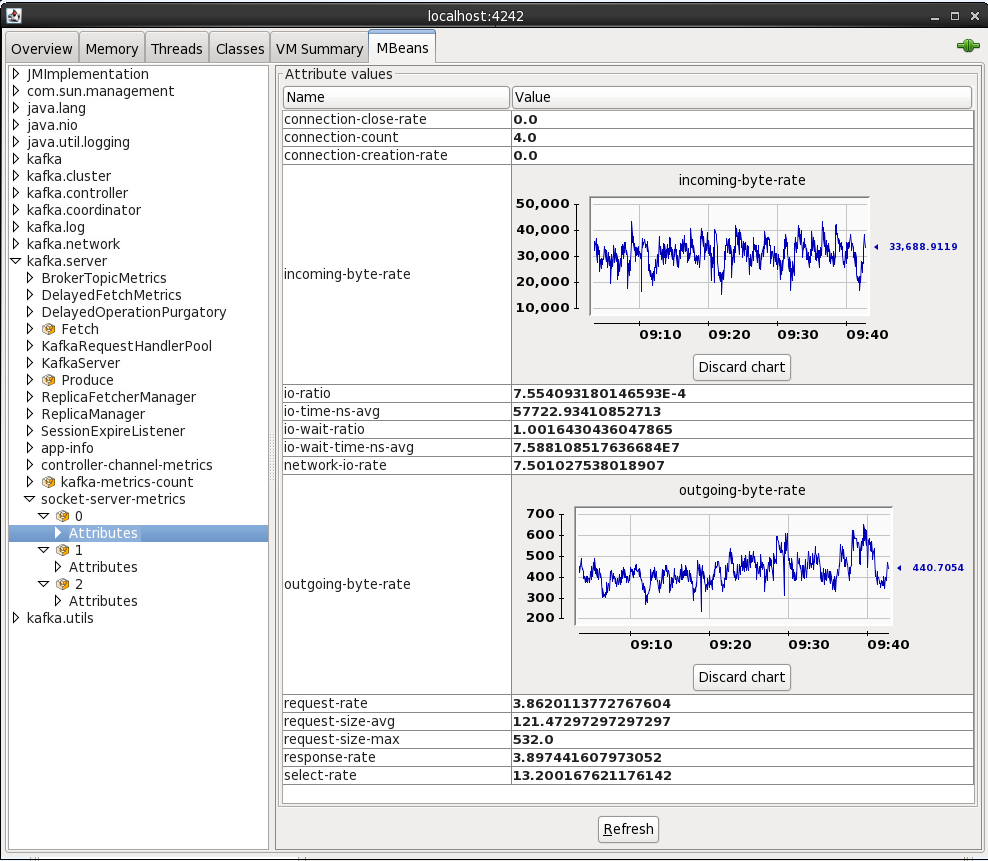
By default when you see an attribute for an MBean is it point-in-time - doubleclick on it to make it a chart that then tracks subsequent changes to the number.
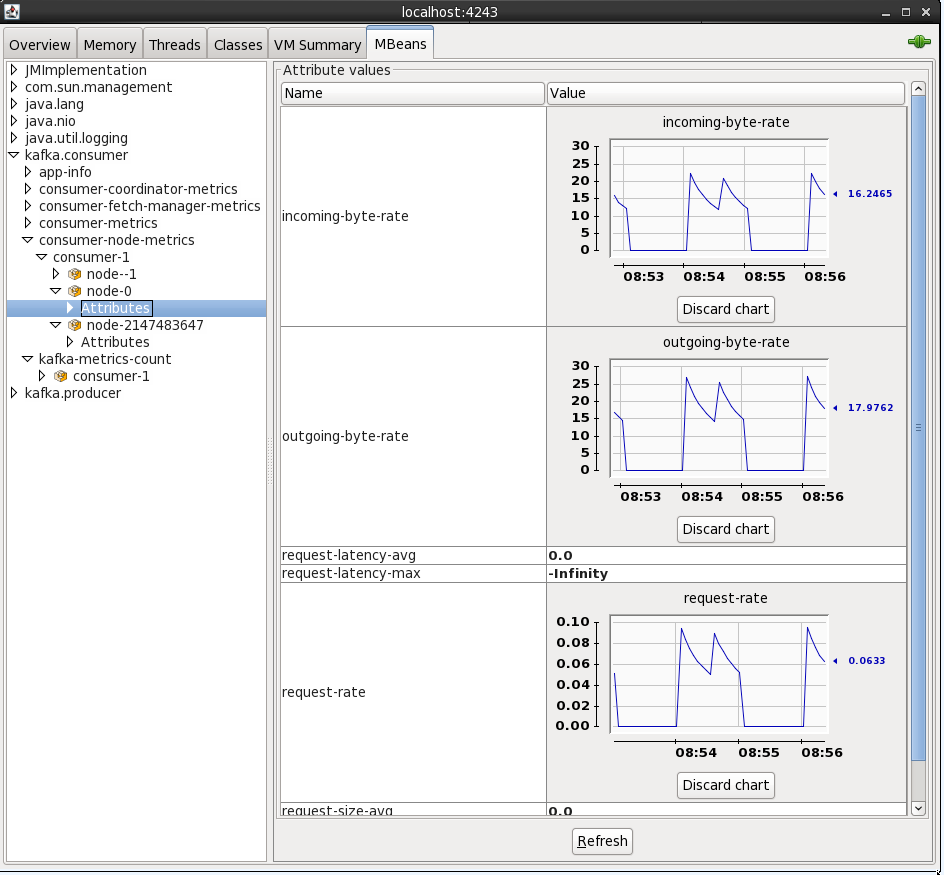
By connecting to localhost:4243 (press Ctrl-N for a new connection in the same JConsole instance) you can inspect the metrics from the Kafka Connect elasticsearch sink
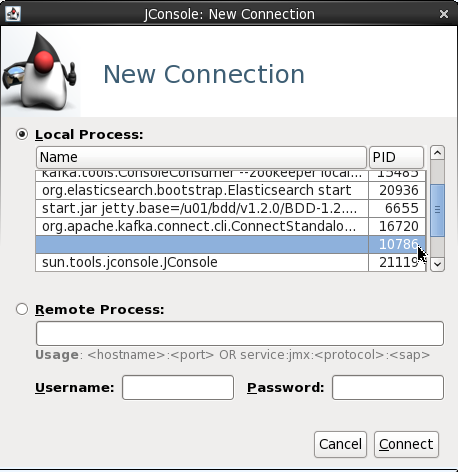
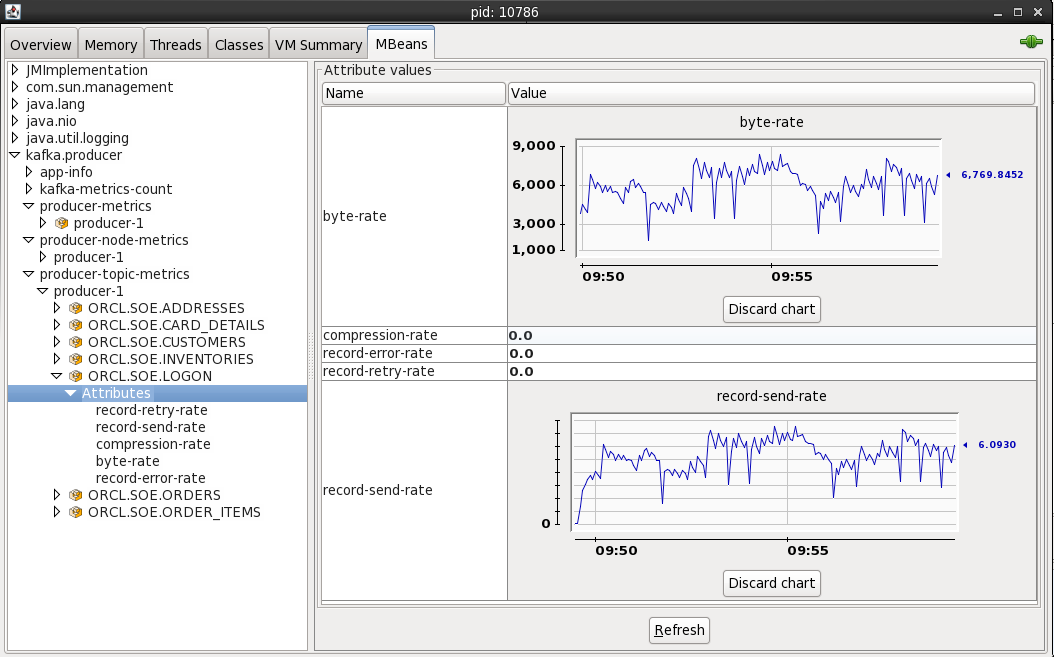
You can also access JMX metrics for the OGG Kafka handler by connecting to the local processs (assuming you're running JConsole locally). To find the PID for the RCONF replicat, run:
$ pgrep -f RCONF
Then select that PID from the JConsole connection list - note that the process name may show as blank.
The producer stats show metrics such as the rate at which topic is being written to:
Conclusion
In this article we've seen how stream transactions from a RDBMS such as Oracle into Kafka and out to a target such as Elasticsearch, utilising the Kafka Connect platform and its standardised connector framework. We also saw how to validate and audit the pipeline at various touchpoints, as well as a quick look at accessing the JMX metrics that Kafka provides.
This article was also posted on the Confluent blog, head over there for more great Kafka-related content!
