Where is My Money Going? Checking the balance with Oracle Cloud Account Metering REST APIs


How much did I spend so far?
It's a typical question we ask ourselves daily and what do we do? Probably check the bank account status on our phone and yell at ourselves for all the money we trashed the previous night at the pub.
The Cloud
One of the great benefits of the cloud is that there is no big upfront cost required to start playing with the latest tool or technology, we just need to fill in a few forms, write down the credit card details and there we go! However, the cloud doesn't mean free: most of the times we pay based on resource and time consumption and things can become pretty expensive if we don't manage our resources wisely.
The main Oracle Cloud Dashboard offers a preview of the Month to Date Cost and by clicking on it, we can easily understand the cost per product. Like in the example below we spend £322.8 month to date and precisely £262.80 on Oracle Analytics Classic.
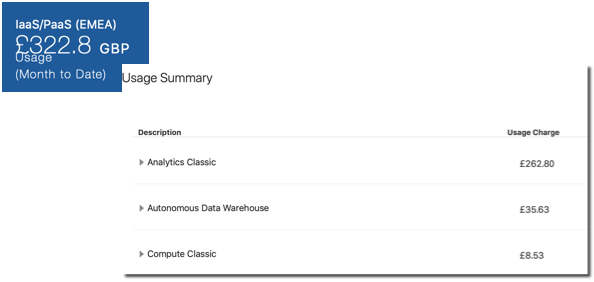
We can go another step down the line: if for example, we have multiple versions of the same product, we'll see a line for each version or licensing method. In our case, all the money comes from a single B88303 - OAC Enterprise Edition OCPU per Hour product with an overall 60 hours of uptime (OAC billing is per hour).

However, this requires a manual login into the Oracle Cloud to check the balance, which is not optimal if we want to display this information in external tools or automate part of the cost-checking procedures. Fortunately, we can retrieve the same information with Oracle Cloud Account Metering REST APIs.
Oracle Cloud Account Metering REST APIs
Oracle Cloud Account Metering REST APIs expose a lot of useful information about our Oracle Cloud account via REST APIs. We can, for example, check our subscription details, credit promotions, resource usage, cost and quotas. All we need to test the REST APIs is cURL, a command-line utility for sending HTTP requests. The syntax to retrieve the data is
curl -X GET -u <USERNAME>:<PASSWORD> \
	-H "X-ID-TENANT-NAME:<TENANT_ID>" \
	"https://itra.oraclecloud.com/<BASE_PATH>/<RESOURCE_NAME>
Where
<USERNAME>and<PASSWORD>are the credentials of an account associated with at least one of the following roles- Identity Domain Administrator
- Cloud Account Administrator
- Service Administrator
<TENANT_ID>is the identity domain ID, you can find it under the Oracle Analytics Cloud -> Overview

<BASE_PATH>is the base URI of the resource, e.g./metering/api/v1<RESOURCE_NAME>is the name of the specific resource we are requesting
Checking the Cost
If, as per the example below, we want to understand the cost, we simply need to call the usagecost resource passing the <ACCOUNT_ID> parameter which can be found in the Overview page of every service we already have in our account.
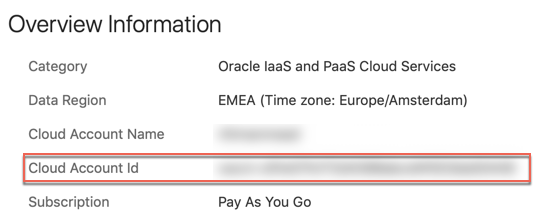
The basic cURL command to check the cost then becomes the following
curl -X GET -u <USERNAME>:<PASSWORD> \
	-H "X-ID-TENANT-NAME:<TENANT_ID>" \
	"https://itra.oraclecloud.com/metering/api/v1/usagecost/<ACCOUNT_ID>?startTime=<START_TIME>&endTime=<ENDTIME>&timeZone=<TIMEZONE>"
Where on top of the parameters defined above we have
<START_TIME>and<END_TIME>with the formatYYYY-MM-DDTHH:mm:sssZe.g.2019-08-01T00:00:00.000<TIMEZONE>we specify which timezone to use for the date and time filter
So if like before, we're aiming to understand the cost from the beginning of the month, our suffix becomes
<ACCOUNT_ID>?startTime=2019-08-01T00:00:00.000Z&endTime=2019-08-10T23:59:00.000Z&timeZone=Europe/RomeThe result is in JSON format which we can easily parse the result with the command line tool jq.
curl -X GET ... | jq '.'The output is
{
  "accountId": "<ACCOUNT_ID>",
  "items": [
    ...
    {
      "subscriptionId": "...",
      "subscriptionType": "PRODUCTION",
      "serviceName": "ANALYTICS",
      "resourceName": "ANALYTICS_EE_PAAS_ANY_OCPU_HOUR",
      "currency": "GBP",
      "gsiProductId": "B88303",
      "startTimeUtc": "2019-08-01T00:00:00.000",
      "endTimeUtc": "2019-08-10T23:00:00.000",
      "serviceEntitlementId": "...",
      "costs": [
        {
          "computedQuantity": 60,
          "computedAmount": 262.8,
          "unitPrice": 4.38,
          "overagesFlag": "Y"
        }
      ]
    },
    ..,
  "canonicalLink": "/metering/api/v1/usagecost/<ACCOUNT_ID>?timeZone=Europe%2FRome&startTime=2019-08-01T00%3A00%3A00.000Z&endTime=2019-08-10T23%3A59%3A00.000Z"
}
As expected, we get, within the items section, an entry for every product and license type we have used. In our case we have the "serviceName": "ANALYTICS", with the Enterprise Edition option billed per hour ("resourceName": "ANALYTICS_EE_PAAS_ANY_OCPU_HOUR") and we used it for 60 hours with a unit price of £4.38 for a total amount of £262.8 perfectly in line with what we see in the webpage.
We can further filter our query using one of the following parameters:
computeType: the nature of the cost (Usage, Overcharge...)datacenter: the datacenter for which cost needs to be retrieveddcAggEnabled: to roll up the cost by datacenterresourceName: the type of resource billing (e.g.ANALYTICS_EE_PAAS_ANY_OCPU_HOUR)serviceEntitlementId: the Id of the service, can be found in the Overview page

serviceName: the name of the service e.g.ANALYTICSusageType: the type of usage we want to be reported eitherTOTAL,HOURLYorDAILY
Unfortunately, none of the above filters allows us to check the cost associated with a precise instance of the service. If, for example, we have two instances with the same edition and type of billing, we can't determine, with the above call, what the cost associated to each of the two instances is since it's rolled up and instance type level. But we're not alone! We can achieve more granularity in the billing metrics by using the /tagged REST API and properly performing instance tagging on our services.
Instance Tagging
We can group instances of various services with Tags. Tags are labels that we can attach to an instance to group them based on our company rules. Oracle allows two types of tagging for resources: free-form and defined.
With free-form tagging we can append any key-value label to our instances, e.g. we may want to tag an instance as Environment:Training with Environment being the key and Training being the label.

The problem with free-form tagging is that we don't have control of which tag keys get associated to a certain resource and it's an error-prone method since we have to type a key and value every time (and they're not visible for cost-tracking).
If instead, we want to use a more controlled approach to tagging, we can then go for the defined tagging: while with free-form anyone was able to associate any key or value, with define tagging we create a namespace which will contain a set of tag keys.
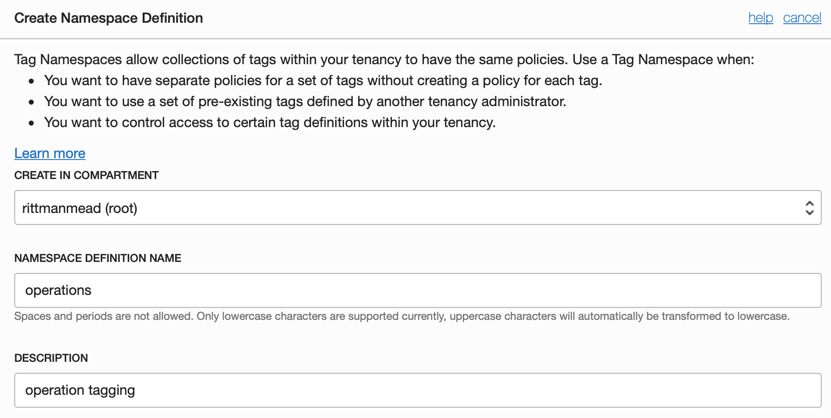
Once created the namespace, we can then create the set of keys within it. In this case, we create two pre-defined keys Environment and Project, please note that we flagged the COST-TRACKING checkbox to be able to use the tags with the Oracle Cloud Account Metering APIs.
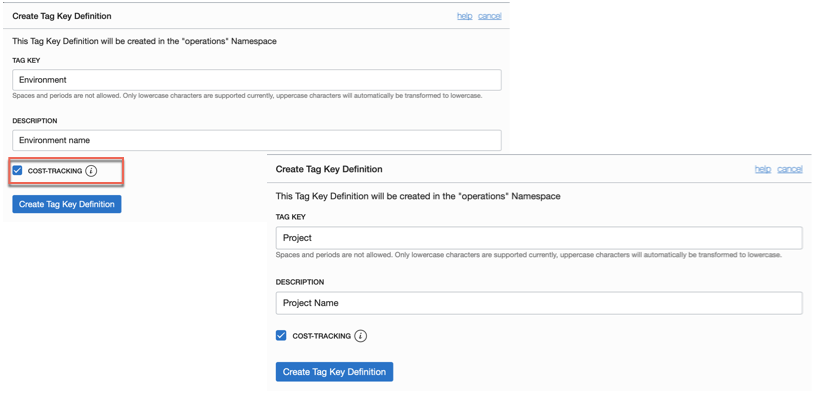
Please be aware that there are limits on the number of namespaces, of tags per resource and of cost-tracking tags which are available under the tagging documentation.
Now it's time to attach the defined tags to our instances, we can do so in the web UI during instance creation or after by selecting "Add Tags". More information under the related documentation.
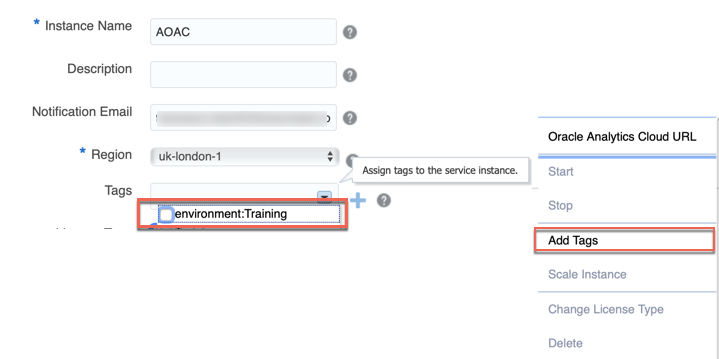
After we added the tags marked for cost-tracking to our instances we may have to wait up to 5 hours to see them in the "My Services" or via the REST APIs.
Querying Tagged Resources
There is an API within the Oracle Cloud Account Metering REST APIs which allows to querying the cost associated with tagged resources. The call is very similar to the one we used above, with the additional tagged prefix and tags=.... parameter. Taking the example above, if we can see the consumption associated with instances tagged as Operations:Project=Training then the call is the following
curl -X GET -u <USERNAME>:<PASSWORD> \
	-H "X-ID-TENANT-NAME:<TENANT_ID>" \
	"https://itra.oraclecloud.com/metering/api/v1/usagecost/<ACCOUNT_ID>/tagged?startTime=<START>&endTime=<END>&timeZone=<TZ>&tags=operations:Project=Training"
And the result is
{
  "accountId": "<ACCOUNT_ID>",
  "items": [
    {
      "subscriptionId": "...",
      "subscriptionType": "PRODUCTION",
      "serviceName": "ADWC",
      "resourceName": "ADWC_PAAS_BYOL_OCPU_HOUR",
      "currency": "GBP",
      "gsiProductId": "B89039",
      "startTimeUtc": "2019-08-01T00:00:00.000",
      "endTimeUtc": "2019-08-10T23:00:00.000",
      "serviceEntitlementId": "...",
      "costs": [
        {
          "computedQuantity": 23.0,
          "computedAmount": 8.06235468,
          "unitPrice": 0.35053716,
          "overagesFlag": "N"
        }
      ]
    }
  ],
  "canonicalLink": "/metering/api/v1/usagecost/<ACCOUNT_ID>/tagged?timeZone=UTC&startTime=2019-08-01T00%3A00%3A00.000Z&endTime=2019-08-10T23%3A59%3A00.000Z&usageType=TOTAL&tags=operations%3AProject%3DTraining"
}
A usage of ADWC for 23 hours for a total of £8.06 which is also visible from the My Services webpage.
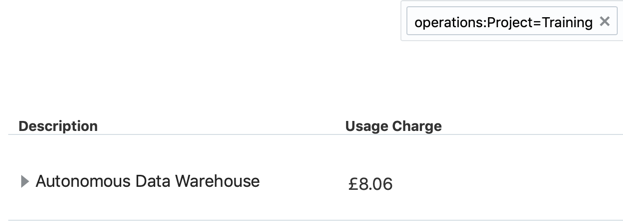
Appending the following jq command to the cURL call also displays the relevant information like serviceName, and cost details as separate columns
jq --raw-output '.items[] | "\(.serviceName)\t\(.subscriptionType)\t\(.resourceName)\t\(.currency)\t\(.costs[].computedAmount)\t\(.costs[].computedQuantity)\t\(.costs[].unitPrice)\t\(.costs[].overagesFlag)"' And the result is
ADWC PRODUCTION ADWC_PAAS_BYOL_OCPU_HOUR GBP 8.06235468 23 0.35053716 NSummary
Oracle Cloud Account Metering REST APIs offer an easy way to expose the Oracle cloud usage and cost externally. Used smartly in conjunction with instance tagging they provide a way to ensure cost and usage tracking down to the single resource or project.
If on the other way, the integration with REST APIs is not what you need, but you're looking into ways of getting notified when you're spending too much, check out the Alerts section of Managing and Monitoring Oracle Cloud.
Edit: You can also download your billing information as CSV from Oracle Cloud web-ui as per screenshot below which is very handy for one-off analysis. If, on the other side, you want to automate the export of billing information, then Oracle Cloud Account Metering REST APIs is the way to go!

