Oracle APEX - Debugging Tip #1

If I would need this feature I would probably invest a lot of time trying to find out an answer. But funny enough I found out by mistake and as it might be useful to someone else I have just decide to publish this short blog post.
Application Process on Global Page
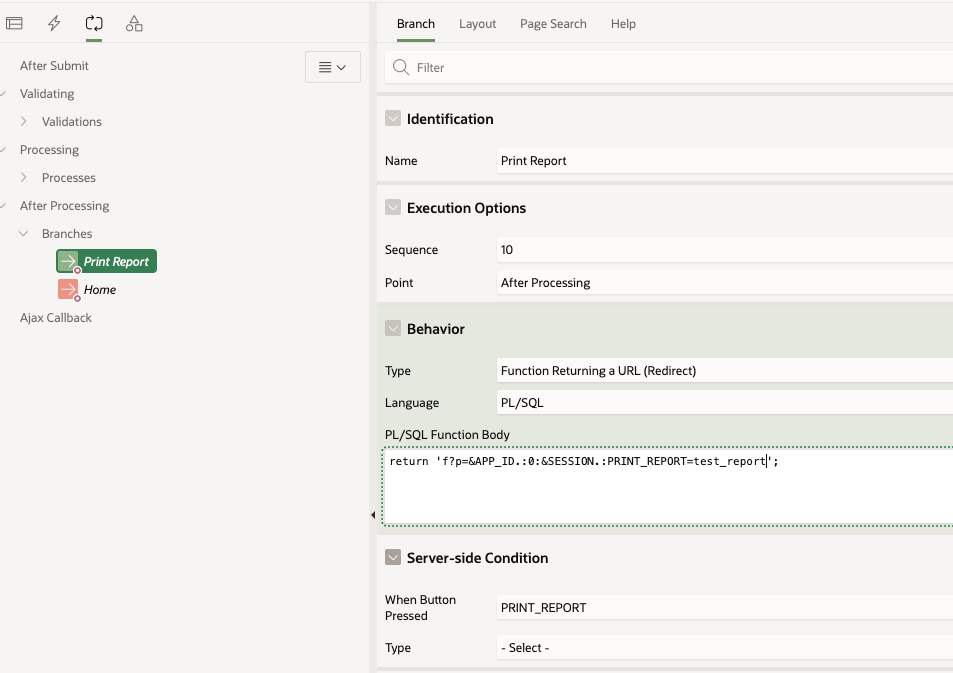
When working with Report queries Oracle APEX creates an URL that you can use in your buttons or branches to call the report itself. That URL uses the global page 0 with an special REQUEST syntax as showed below.

I used that URL in a branch that fires when the "PRINT_REPORT" button is pressed:

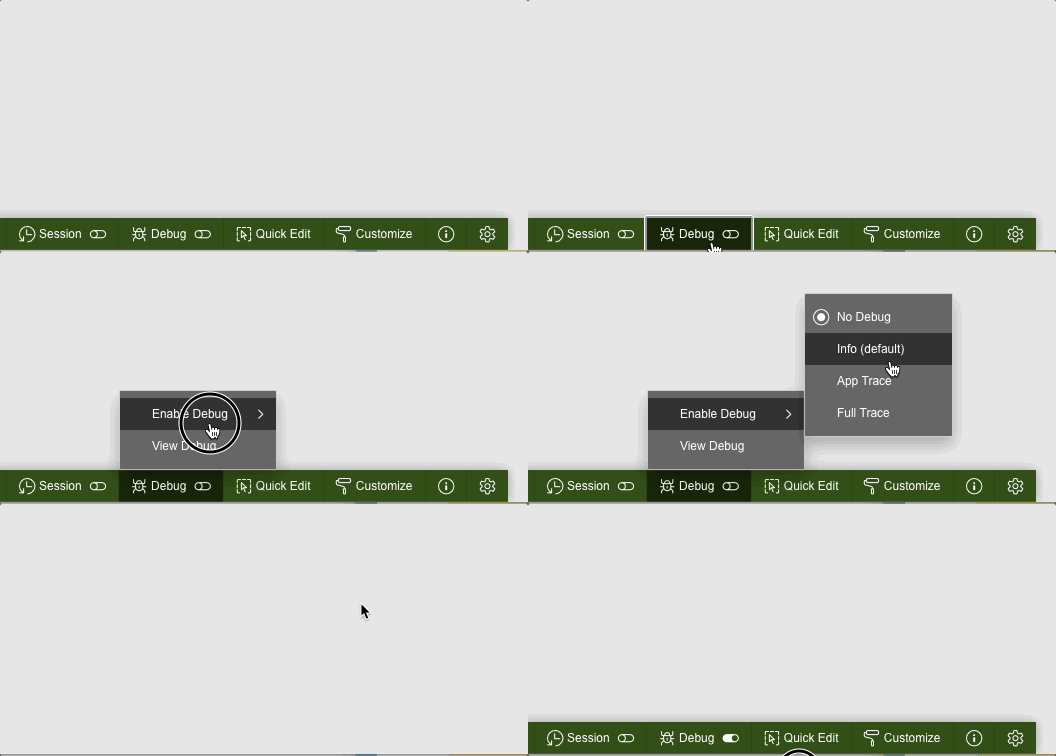
While trying to debug this process you might run into the following problem. If you enable debugging from the Developer toolbar like this:

or from the URL:

the page 0 process won't be debug. The output of the debug trace from the "View debug" option will be limited to the call of the button on page 1.

Same goes for the Session Activity view:

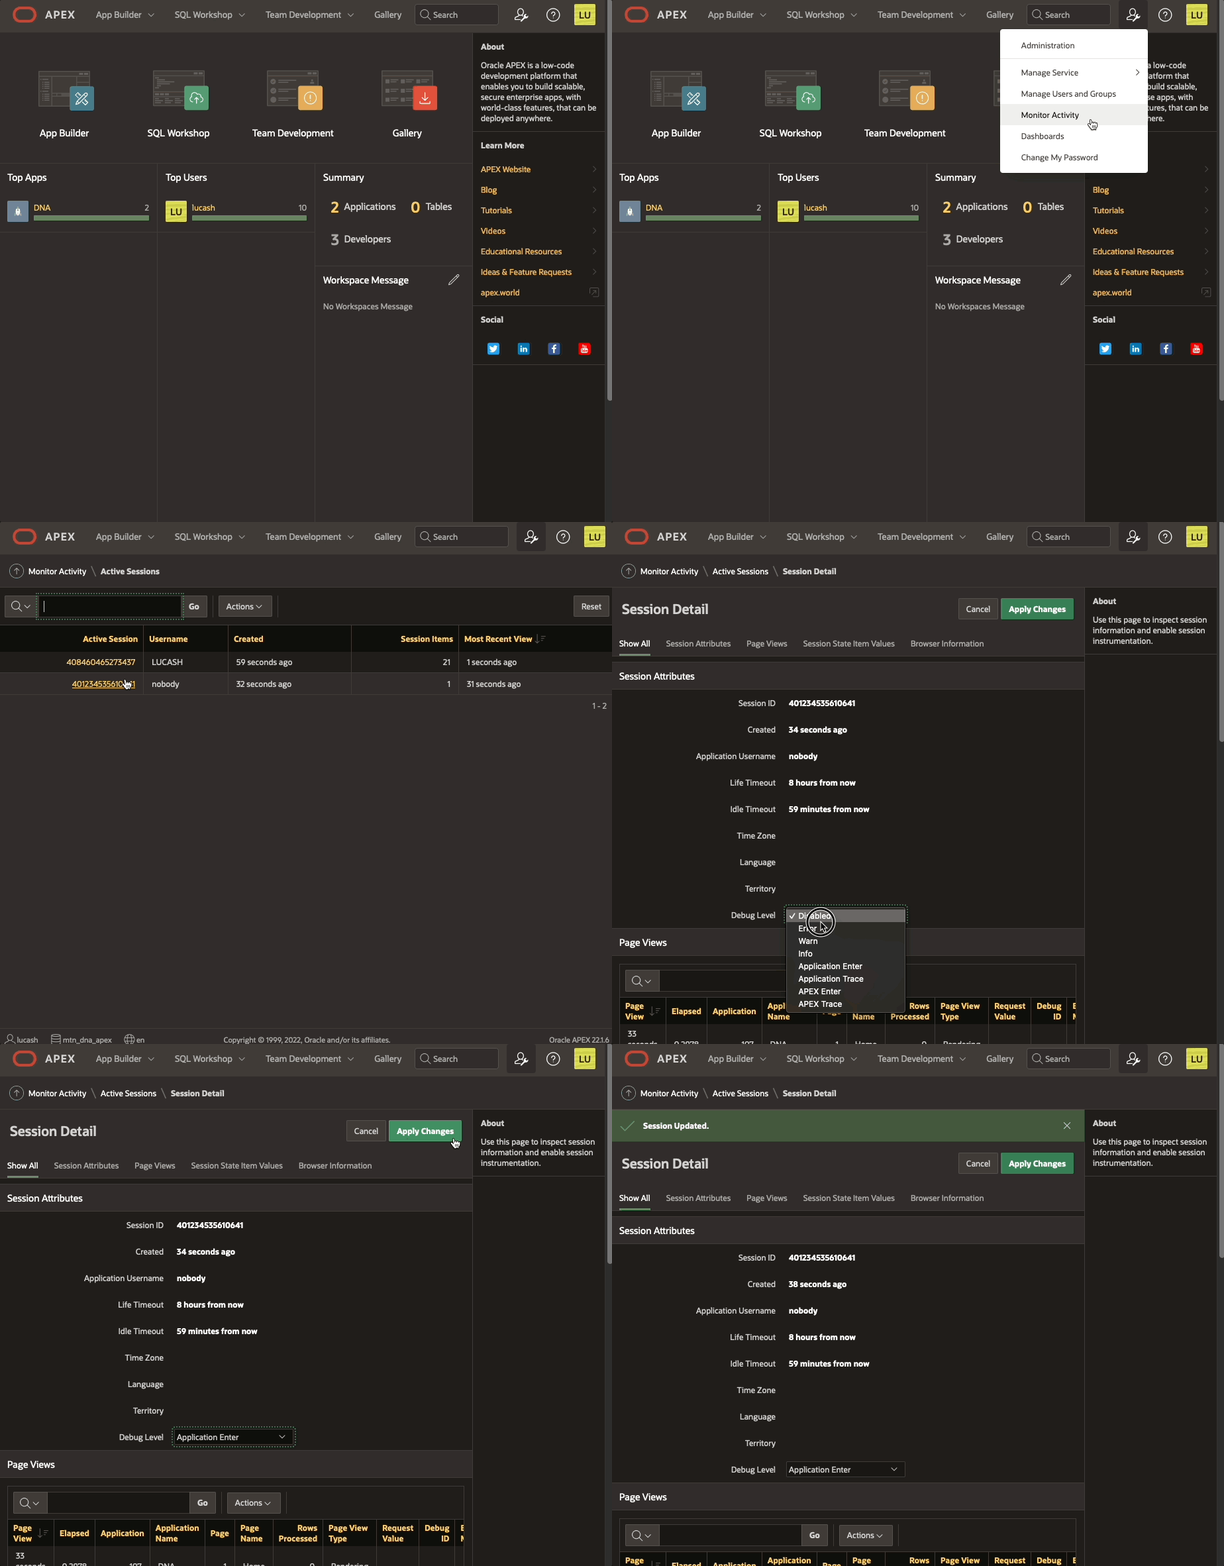
On then contrary, if you enable debug from Monitor Activity > Active Sessions > Session Details

Debugging happens as well in page 0 processes. The "View debug" show the debug line:

Same information is displayed in the Session details:

Oracle APEX bug or feature?
Not sure if that is a bug or a feature and don't think is relevant at this stage. The important bit here (and applies for every aspect of the development cycle) is that we get to know different ways of reaching the same end, different methods to try, to keep us going forward :)
Find out more about our APEX services
